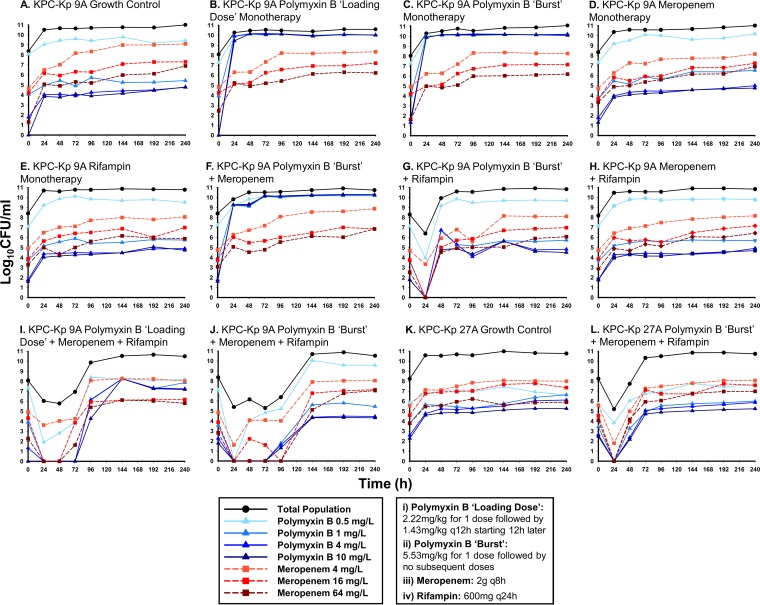
FIG 2.
Population analysis profiles quantifying the growth of resistant KPC-Kp 9A (A to J) and KPC-Kp 27A (K to L) subpopulations on MHA plates containing the specified concentration of either polymyxin B (blue lines) or meropenem (red lines). Each panel represents a single antibiotic treatment regimen over 240 h in the HFIM and compares data from the antibiotic-resistant subpopulations, which are fractions of the respective total population (black lines). The black lines are displayed for comparison and represent the total population bacterial counts from Fig. 1 at time points when population analysis profiles were simultaneously performed (0, 24, 48, 72, 96, 144, 192, and 240 h). KPC-Kp 9A and KPC-Kp 27A polymyxin B MICs were initially 0.5 and 1 mg/liter, respectively. Polymyxin B MICs at the end of each experiment, following exposure for 240 h in the HFIM, were 0.5 mg/liter (A), >32 mg/liter (B), >32 mg/liter (C), 0.5 mg/liter (D), 0.5 mg/liter (E), >32 mg/liter (F), 0.5 mg/liter (G), 0.5 mg/liter (H), 32 mg/liter (I), 0.5 mg/liter (J), 0.5 mg/liter (K), and 0.5 mg/liter (L). KPC-Kp 9A and KPC-Kp 27A remained polymyxin susceptible following exposure to all combinations containing a polymyxin B burst plus rifampin.

