
FIG 1.
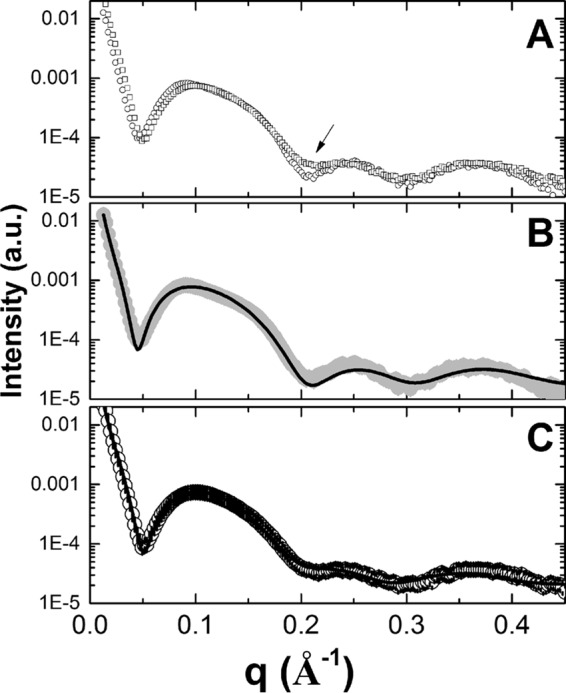
(A) SAXS curves of PS-LP (○) and BPQ-LP (□). (B) SAXS curve of LP (solid gray circles), along with the best-fit data using only one theoretical model. (C) SAXS curve of BPQ-LP (○), along with the best-fit data using the combination of two theoretical models. The arrow in panel A indicates small changes in the membrane scattering curve due to the presence of BPQ.