
FIG 2.
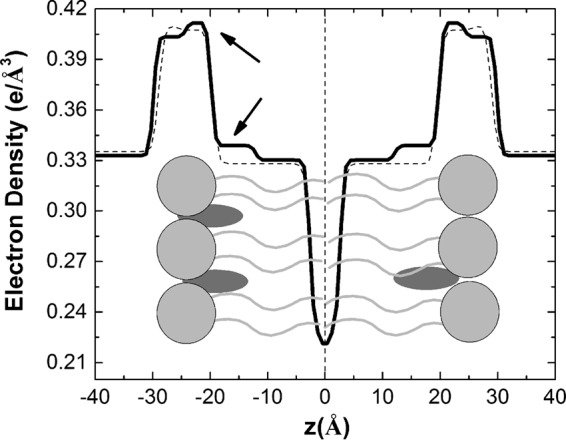
Electron density profiles for the membrane in the absence (dashed line) or presence (solid line) of BPQ. Inside the plot there is a schematic representation of the bilayer composed by the lipids (light gray) and the BPQ molecule (dark gray). Arrows indicate altered regions.