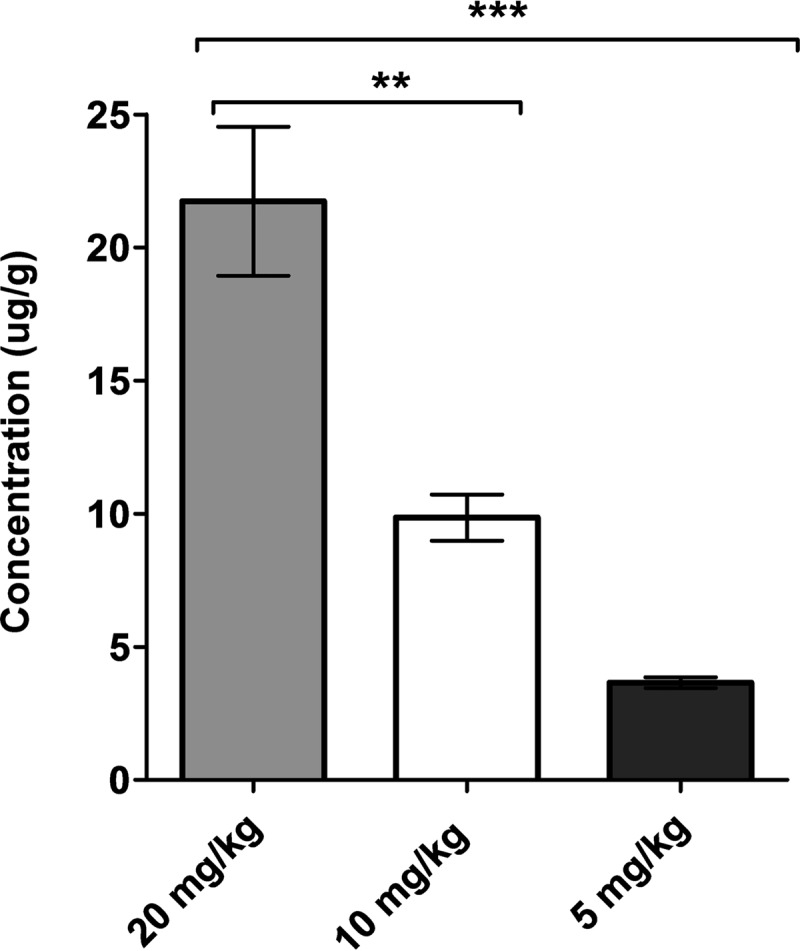
FIG 2.

Renal tissue concentrations at escalating dose levels of polymyxin B. Vertical error bars represent the mean standard deviation within a group. The post hoc Tukey's test was used for multiple 2-way comparisons of means among different groups (***, P < 0.001; **, P < 0.01).
