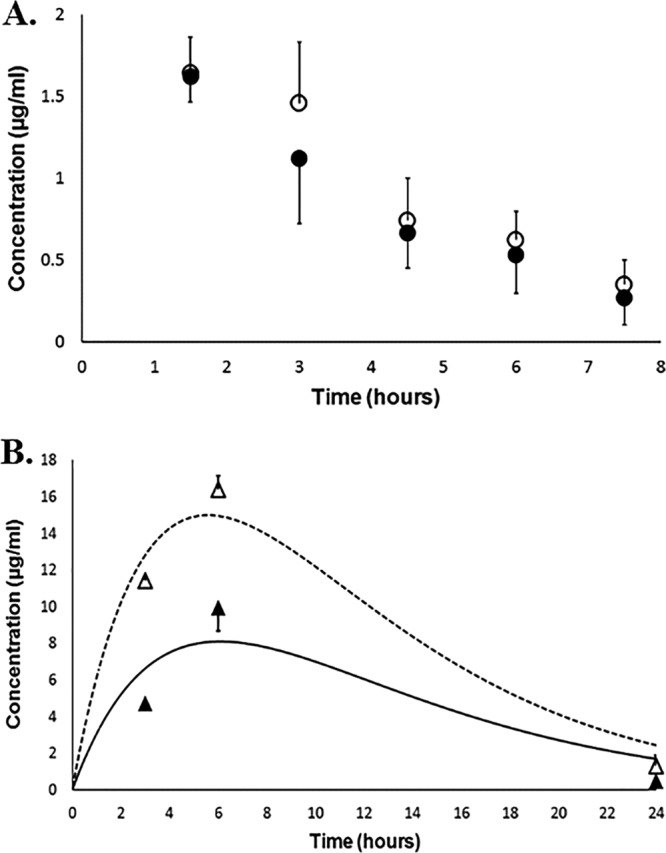
FIG 4.

Mean polymyxin B concentrations in serum and renal tissues. Filled and open circles represent mean serum concentrations of polymyxin B in the experimental and control groups, respectively; filled and open triangles represent mean renal tissue concentrations of polymyxin B in the experimental and control groups, respectively. The dotted line is the best-fit line for the renal concentration-time profile in the control group, whereas the solid line is the best-fit line for the renal tissue concentration-time profile in the treatment group. Vertical error bars represent the standard deviation at each time point.
