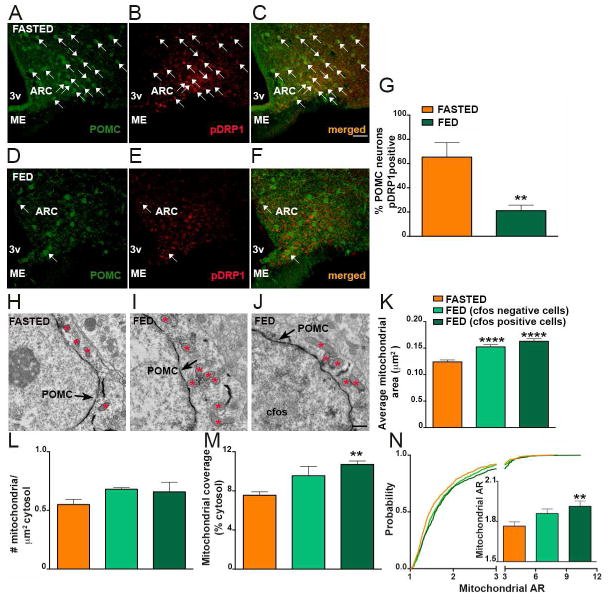
Fig. 1. Decreased DRP1 activation in POMC neurons of fed mice.
(A–C) Representative light micrograph showing immunostaining for POMC (green; A) and phosphorylated DRP1 (pDRP1; red; B) and merged (C) in the arcuate nucleus of the hypothalamus of a fasted mouse.
(D–F) Representative light micrograph showing immunostaining for POMC (green; D) and phosphorylated DRP1 (pDRP1; red; E) and merged (F) in the arcuate nucleus of the hypothalamus of a fed mouse. Arrows point to colocalizing cells.
(G) Graph showing the percentage of POMC neurons immunopositive for pDRP1 (n= 6 per group).
(H–J) Representative electron micrographs showing mitochondria (asterisks) in a silent (cfos negative) POMC neuron of a fasted mouse (H), a silent (cfos negative) POMC neuron of a fed mouse (I) and an activated POMC cell (cfos positive) of a fed mouse (J). Arrows indicate POMC staining. Note cfos staining in the nucleus of the cell shown in J.
(K–N) Average mitochondrial area (K), mitochondrial density (L), mitochondrial coverage (M), and cumulative probability distribution of mitochondrial aspect ratio (N) in silent POMC neurons from fasted and fed mice and activated POMC neurons of fed mice (fasted mice, n = 700 mitochondria/15 cells/3 mice; fed mice, n=674 mitochondria/14 cfos negative cells/3mice and n=557 mitochondria/14 cfos positive cells/3mice).
Bar scale in C (for A–F) represents 50 μm. Bar scale in J (for H–J) represents 500 nm. 3v= third ventricle; ARC= arcuate nucleus; ME= median eminence. Data are represented as mean ± SEM. **=P<0.01 compared to fasted; and ****=P<0.0001 compared to fasted.

