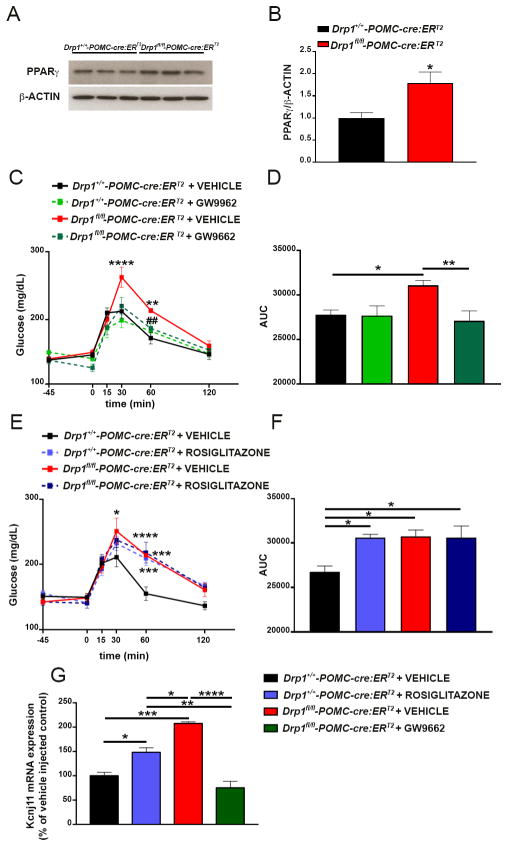
Figure 6. Inducible deletion of DRP1 in POMC neurons alters PPARγ expression and PPARγ modulation affects 2DG-induced hypoglycemia and Kcnj11 mRNA levels.
(A) Representative Western Blot images for PPARγ and β-actin in arcuate punches of Drp1+/+-POMC-cre:ERT2 and Drp1fl/fl-POMC-cre:ERT2 mice.
(B) Graph showing densitometry results for PPARγ in arcuate punches of Drp1+/+-POMC-cre:ERT2 (n=5) and Drp1fl/fl-POMC-cre:ERT2 mice (n=5).
(C) Graph showing changes in glucose levels after 2DG injection given 45 minutes after either GW9662 (icv, 1μg/μl) or vehicle (same volume) in Drp1+/+-POMC-cre:ERT2 (n=12 mice with vehicle; n=7 mice with GW9662) and Drp1fl/fl-POMC-cre:ERT2 mice (n=9 mice with vehicle; n=9 mice with GW9662).
(D) Graph showing the results of the area under the curve (AUC) of the 2DG test shown in C.
(E) Graph showing changes in glucose levels after 2DG injection given 45 minutes after either rosiglitazone (icv, 1μg/μl) or vehicle (same volume) in Drp1+/+-POMC-cre:ERT2 (n=6 mice for both vehicle and rosiglitazone) and Drp1fl/fl-POMC-cre:ERT2 mice (n=6 mice for both vehicle and rosiglitazone).
(F) Graph showing the results of the area under the curve (AUC) of the 2DG test shown in E.
(G) Graph showing Kcnj11 mRNA levels in arcuate punches of Drp1+/+-POMC-cre:ERT2 mice 45 minutes after icv injection of either vehicle or rosiglitazone (n=4 mice per group), and Drp1fl/fl-POMC-cre:ERT2 mice 45 minutes after icv injection of either vehicle or GW9662 (n=4 mice per group).
Data are represented as mean ± SEM. *=P<0.05; **=P<0.001; ***=P<0.001; ****=P<0.0001.

