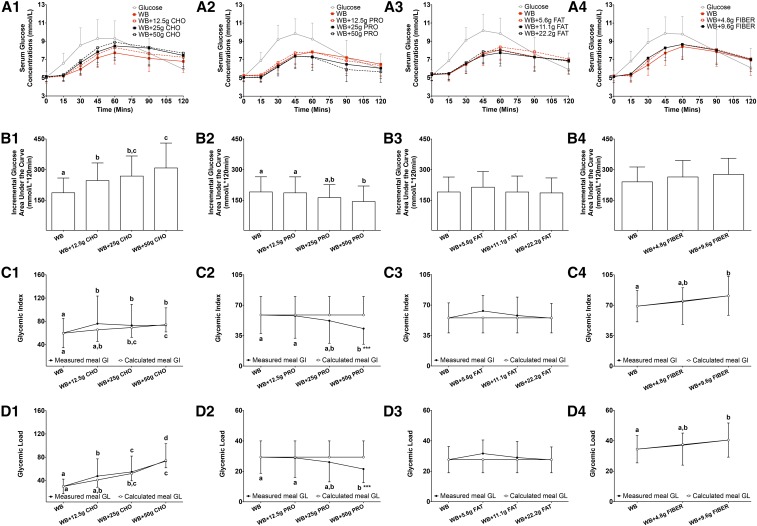
FIGURE 1.
Mean ± SD glycemic response and measured and calculated meal GI and GL after the consumption of a glucose reference and WB with different amounts of additional macronutrients or fiber. Serum postprandial glucose concentrations (A1–A4), incremental glucose AUC (B1–B4), measured and calculated meal GI (C1–C4), and measured and calculated meal GL (D1–D4) after the food challenges or consumption of the glucose reference drink during the 2-h test period are presented for studies 1–4. Differences in serum postprandial glucose concentrations (A1–A4) in food challenges over the 2-h test period were determined with the use of 2-factor mixed ANOVA with the main effects of food challenges and time and the food challenges × time interaction with repeated measures. Differences in the incremental glucose AUC (B1−B4), measured and calculated meal GI (C1–C4) and measured and calculated meal GL (D1–D4) values in food challenges over the 2-h test period in each individual study were determined with the use of mixed-design ANOVA model with the participant as a random effect and the food challenge as a fixed effect. The Tukey-Kramer method was used for the post hoc analyses. Differences in calculated meal GI and GL values in study 1 were compared with the use of Friedman’s chi-square test with Dunn’s multiple-comparison test as post hoc analyses. Differences between measured and calculated meal GI and GL values within each food-challenge group were compared with the use of a paired t test or Wilcoxon’s signed rank sum test depending on the data distribution. The statistical analysis was performed only with food challenges that contained WB and did not include the glucose reference drink. Statistical analyses with measured meal GI and GL values and calculated meal GI and GL values were performed separately. Significance was accepted at P ≤ 0.05. Means denoted by different lowercase letters were significantly different from each other. ***Significantly different from calculated meal GI or GL values within the same food-challenge group, P < 0.001. Sample sizes for studies 1–4 were 20, 22, 20, and 20, respectively. CHO, carbohydrate; GI, glycemic index; GL, glycemic load; PRO, protein; WB, white bread.

