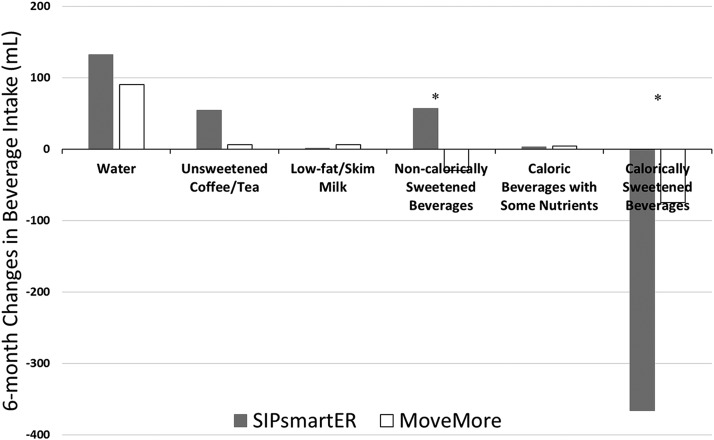
FIGURE 1.
Changes in consumption of beverage categories from baseline to 6 mo between SIPsmartER (n = 149) and MoveMore (n = 143) participants. *Significant between SIPsmartER and MoveMore conditions, P ≤ 0.05 (ANOVA with intention to treat, which used the baseline-observation-carried-forward imputation procedure).

