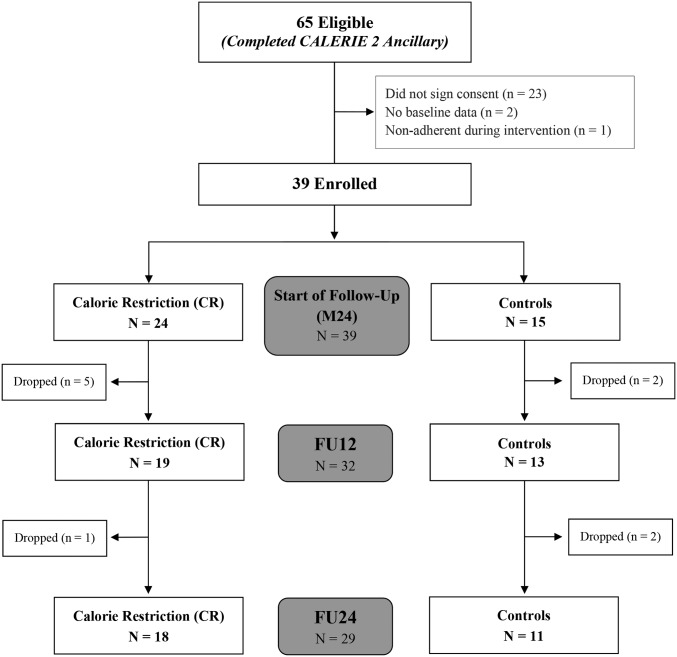
FIGURE 1.
CALERIE 2 follow-up Consolidated Standards of Reporting Trial diagram. Participant throughput from enrollment (n = 39) to data analysis (n = 29). Analyses were performed on 29 men and women who on the basis of objective criterion (weight change) were determined to be adherent to their assigned treatment groups during the intervention. CALERIE 2, Comprehensive Assessment of Long-Term Effects of Reducing Intake of Energy Phase 2; CR, calorie restriction; FU12, follow-up at 12 mo; FU24, follow-up at 24 mo; M24, month 24 of the 2-y intervention.

