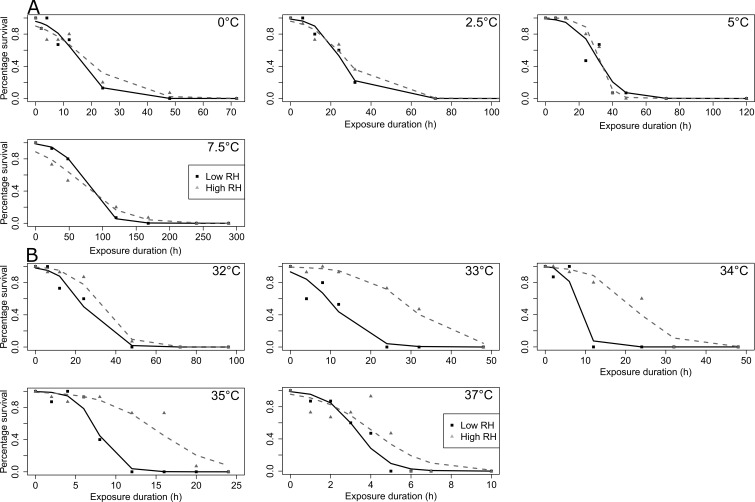
Figure 5. SWD pupal survival as a function of temperature and exposure duration under two relative humidity (RH) levels.
(A) Cold exposure; (B) Heat exposure. Points correspond to observed data, and lines to GLM predictions. The tested temperatures are indicated in the left top corner of each plot. Black solid lines: low RH, grey dashed lines: high RH.

