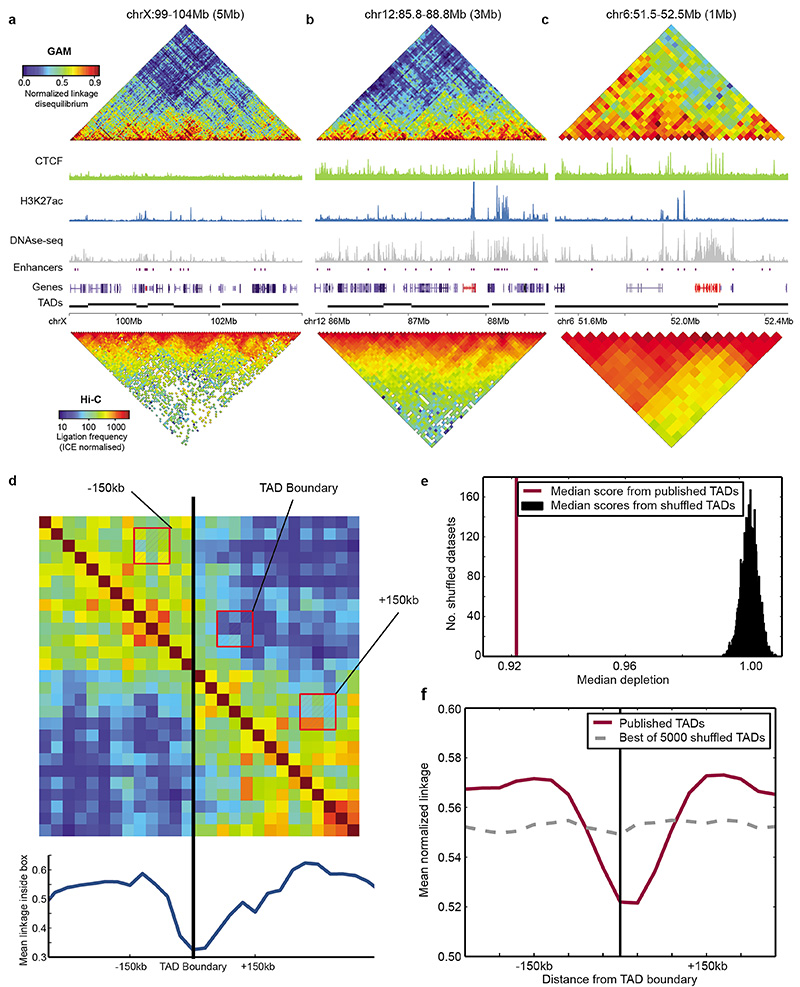
Extended Data Figure 7. GAM reproduces a significant depletion of long-range contacts around previously identified TAD boundaries.
a, TAD organization of the Xist locus (Xist highlighted in red). b, TAD organization of the Esrrb locus (Esrrb highlighted in red). c, TAD organization of the HoxA locus (HoxA gene cluster highlighted in red). d, Depletion of long-range contacts observed when a 3x3 window box is moved across an example TAD boundary, at an offset of 2 windows from the matrix diagonal (i.e. insulation score). e, Median ratio between linkage observed at a boundary vs. 150 kb upstream and downstream of the boundary was significantly lower for a previously published list of TAD boundaries in mESC (purple line) than for 5000 randomly shuffled versions of the list (permutation test, P < 2x10⁻⁴; black histogram). f, Average profile of long-range contacts calculated over all TAD boundaries (purple line). The average profile with the largest depletion observed after 5000 random permutations of TAD boundaries is shown for comparison (dashed grey line).

