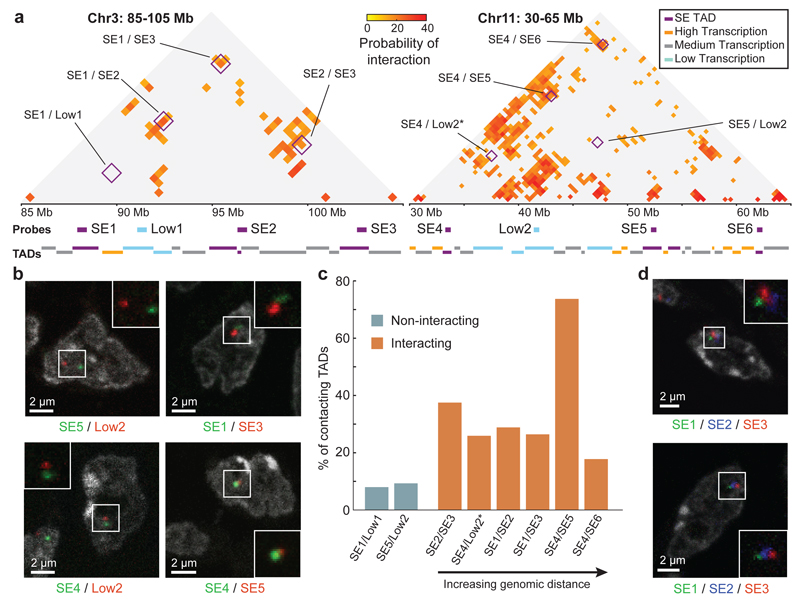
Figure 5. Complex interactions between SE-TADs span tens of megabases.
a, SLICE probability of interaction (Pi) matrices for two genomic regions spanning 20 and 35 Mb. Positions of 500 kb FISH probes are indicated. Interactions between tested combinations of TADs are indicated (purple boxes). *The predicted Pi for SE4/Low2 is not represented in the matrix as it falls just below the significance threshold at their genomic distance. b, CryoFISH images of DAPI-stained cryosections highlight examples of interacting and non-interacting TAD pairs. c, Frequency of TAD-TAD contacts from cryoFISH images. d, Images show examples of TAD triplets.

