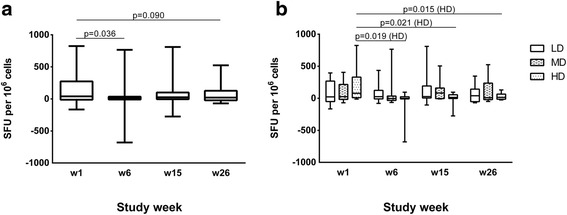
Fig. 3.

Vacc-C5-specific IFN-γ responses. a IFN-γ responses for the total cohort at week 1 (baseline), 6 (after initial immunisation), 15 (after1st boost) and 26 (after 2nd boost, end of study). Data are given as medians, interquartile and overall ranges. Changes with p-values less than 0.10 are indicated (Wilcoxon matched pairs test). b IFN-γ responses for the three dose groups at week 1, 6, 15 and 26. LD = low, MD = median and HD = high dose. Data are given as medians, interquartile and overall ranges. Significant changes within each dose group are indicated (Wilcoxon matched pairs test)
