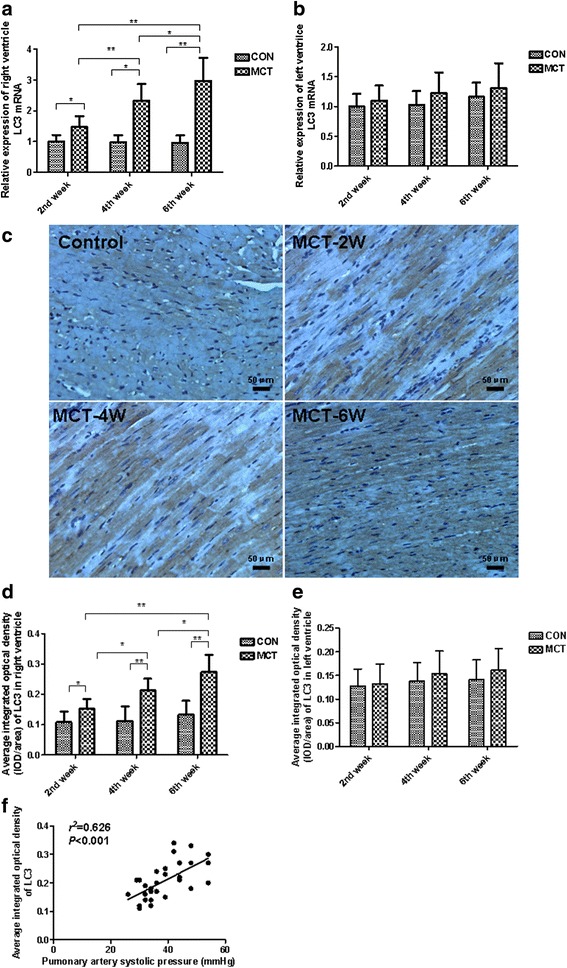
Fig. 4.

Expression of the autophagic marker, LC3, is upregulated in the RV of the MCT rat model. a, b RT-qPCR of LC3 mRNA expression relative to GAPDH in RV (left) and LV (right) tissue of control and MCT-treated rats. GAPDH was used as a loading control. c, d Representative RV tissue sections immunostained for LC3 protein (dark brown) in control and MCT-treated rats. Note: Dark brown granules in myocardial cell cytoplasm. Black scale represents 50 μm (×200 original magnification). e, f Quantification of LC3 positive protein signal (integrated optical density) in RV (left) and LV (right) tissue sections per field area. g Correlation of pulmonary artery systolic pressure with LC3 positive protein signal in 2, 4, and 6 week MCT-treated rats. * P < 0.05, ** P < 0.01. Values are presented as mean ± standard deviation
