
Fig. 5.
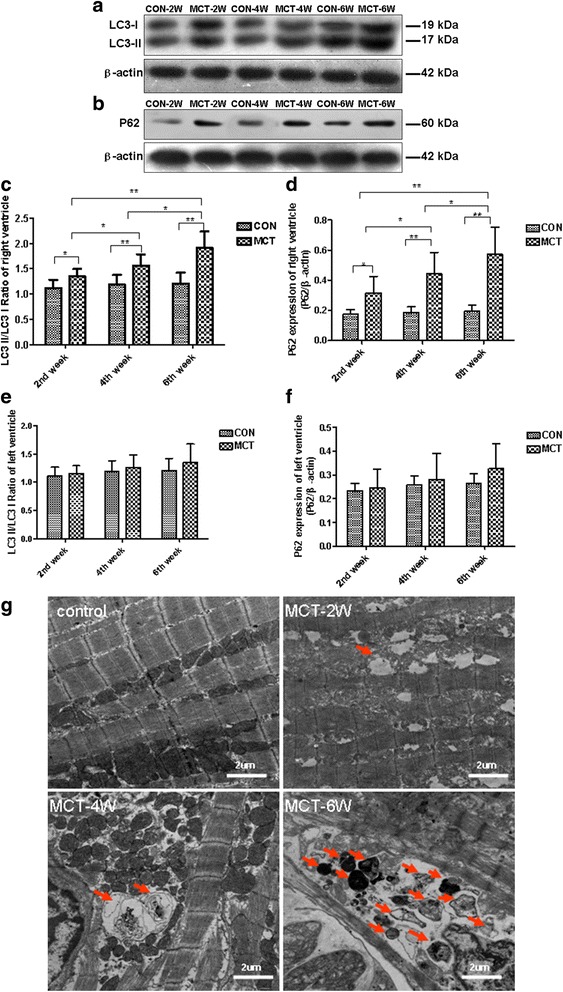
Autophagic induction in the RV of MCT rats. a, b Protein blot analysis of autophagy-related proteins, LC3II, LC3I, and p62 in RV protein extracts from control and MCT-treated rats. β-actin was used as a loading control. c-f Quantification of LC3II to LC3-I ratio (right) and p62 (left) protein expression normalized to β-actin levels. g Representative transmission electron micrographs from RV of control and MCT-treated rats. Arrows indicate autophagosomes. White scale represents 2 μm (15,000× original magnification). Values are presented as mean ± standard deviation. * P < 0.05, ** P < 0.01