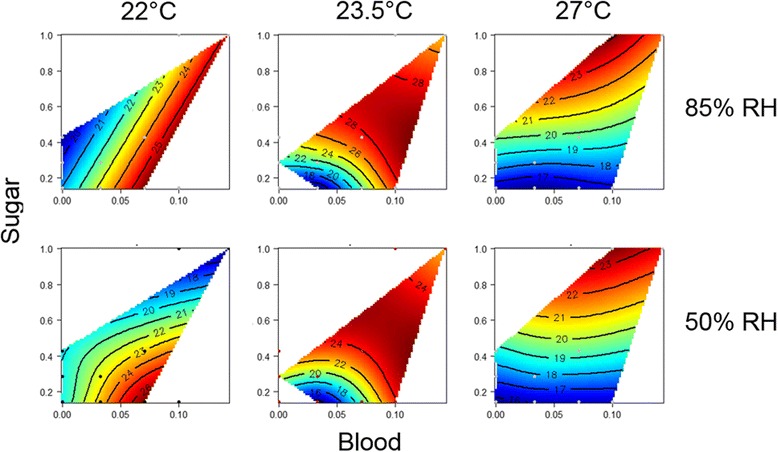
Fig. 5.

2D heat maps (thin-plate splines) of median lifespan in the six temperature/relative humidity (RH) combinations. Red regions in each response surface indicate greatest values for median lifespan. Blue regions indicate lowest values. Contour lines within the nutrient space display lifespan in days and reflect the specific combination of blood and sugar
