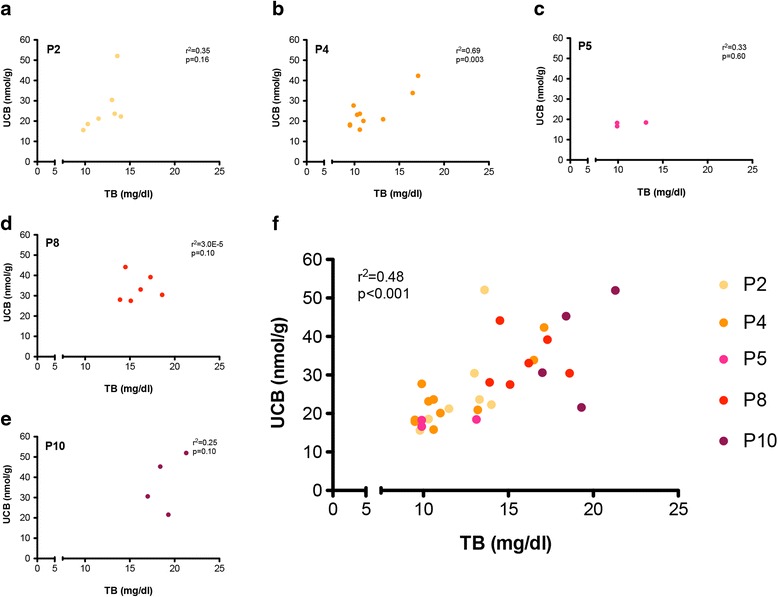
Fig. 2.

Correlation analysis between total plasma bilirubin and cerebellar bilirubin content at different post-natal ages. Plasma total bilirubin (mg/dL) and cerebellar UCB content (nmol/g) were plotted at each single time point: a P2, b P4, c P5, d P8 and e P10. f All time points in a single graph. Each dot represents a single animal. Correlation analyses were done using the Pearson coefficient to assess the linearity between two variables and calculate two-tailed p value (95% of confidence interval)
