
Fig. 5.
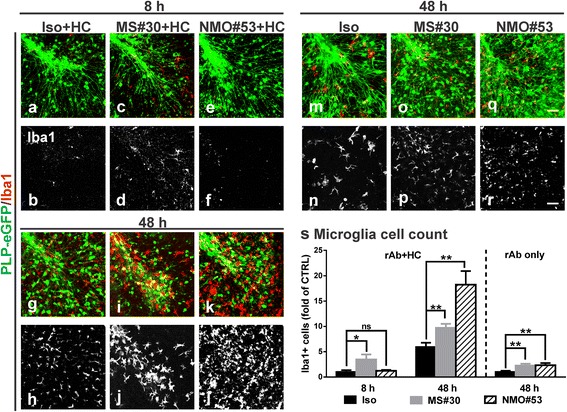
Activation of microglia in MS#30 and NMO#53 treated slices. Cerebellar slices treated with rAbs with (a–l) or without (m–r) HC were fixed at indicated time points and then stained with microglia marker Iba1 (red). Quantification of Iba1+ cell numbers in slices (s). Cell count was normalized to control (Iso + HC treated slices at 8 h in rAb + HC panel and Iso treated slices at 48 h in rAb only). Statistical analyses were performed using multiple unpaired Student’s t test. *: p < 0.05, **: p < 0.01, ns: not significant, n = 4. Scale bars: 50 μm