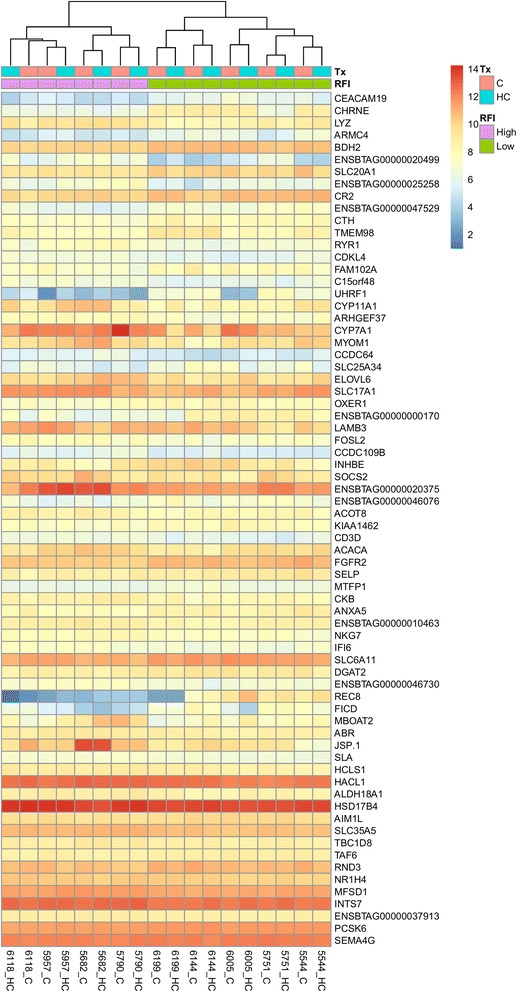
Fig. 1.

Heatmap showing the gene expression data of the 70 significantly differentially expressed genes (padj < 0.05) annotated with the gene ID in Holsteins without the interaction term. The data are log2 normalized. Tx = Treatment diet; C = Control diet; HC = High concentrate diet; RFI = Residual Feed Intake groups
