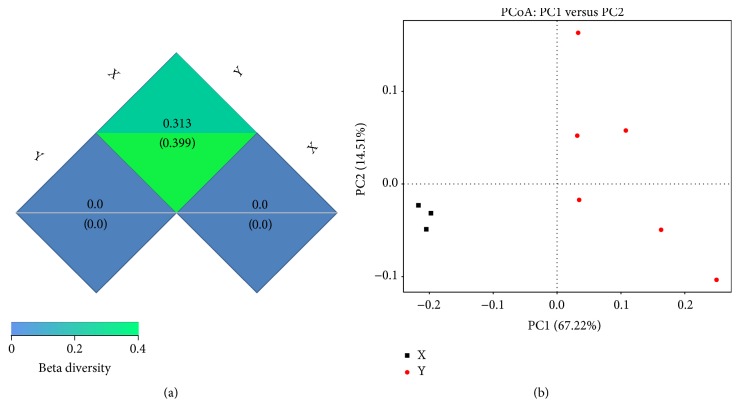
Figure 4.
(a) Beta diversity (weighted UniFrac) among two groups. The letter “X” represents diversity of the constipation group and “Y” represents diversity of the 1.0% Gln group. Beta diversity indexes were measured based on weighted UniFrac and unweighted UniFrac distances. The upper and lower numbers in the grid represent the weighted UniFrac and unweighted UniFrac distances, respectively. (b) PCoA plot based on the weighted UniFrac metric. The letter “X” represents clusters of the constipation group and “Y” represents clusters of the 1.0% Gln group.

