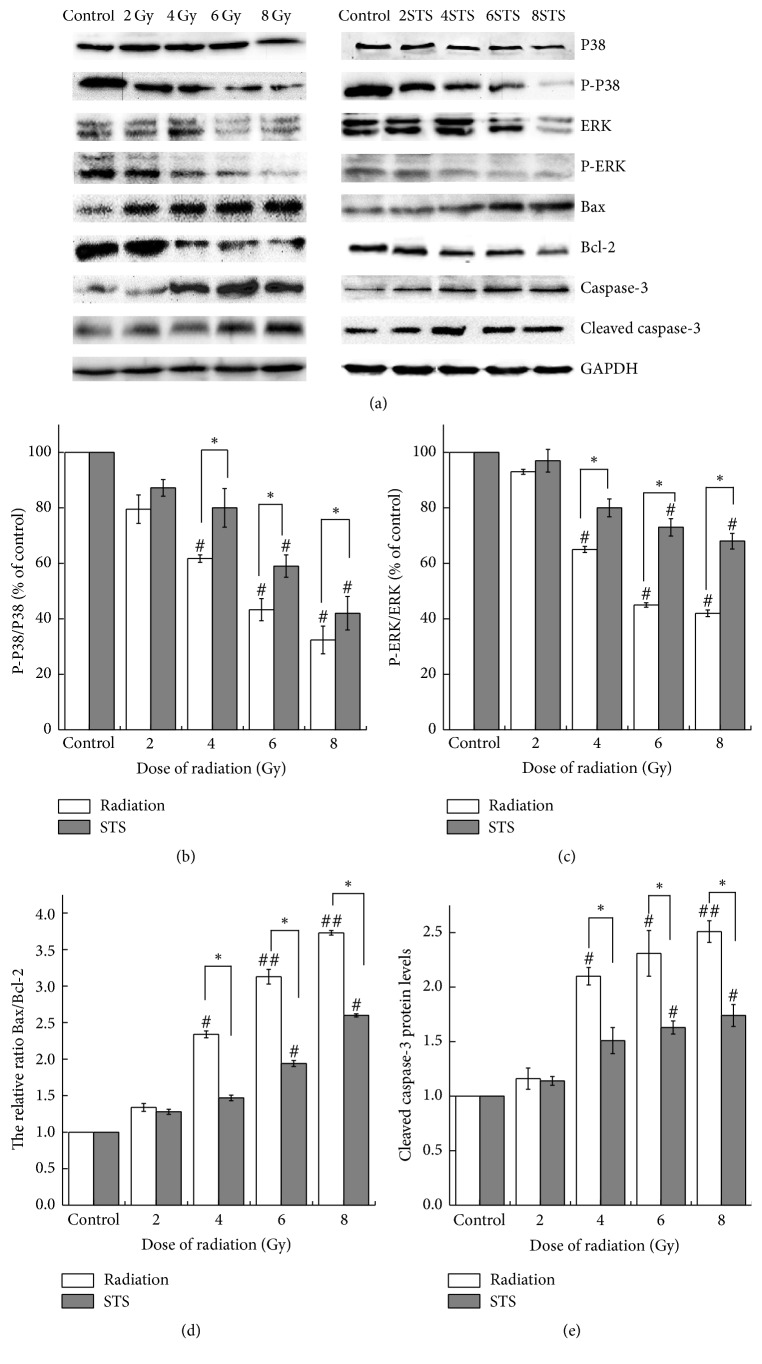
Figure 8.
STS modulated the expression of Bcl-2, Bax, Bax/Bcl-2, p-p38, and p-ERK as well as the activation of caspase-3 in the radiation alone group (a), compared to the control group, as detected by western blotting. (b), (c), (d), and (e) represent the relative protein expression levels and are presented as the mean ± SD. #p < 0.05 and ##p < 0.01 versus the control group; ∗p < 0.05 versus the corresponding radiation alone group. All experiments were repeated three times.

