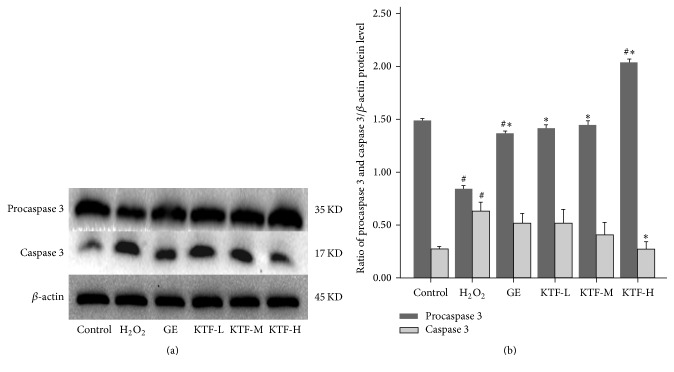
Figure 4.
Effect of KTF on the protein expression of caspase 3 in H2O2-induced MES23.5 cells. (a) The protein expression of caspase 3 was determined with western blot and quantified in (b). Data are expressed as mean ± SD in three independent experiments. #P < 0.05 compared to the control group. ∗P < 0.05 compared to the H2O2 -treat group.

