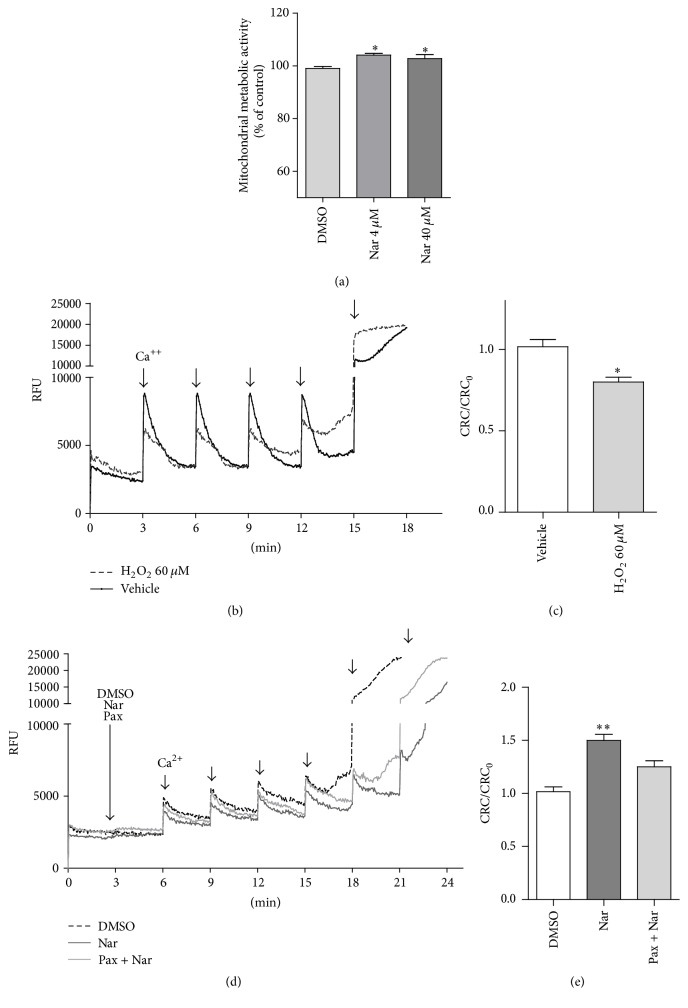
Figure 4.
Effects of H2O2 and Nar on the mitochondrial oxidative metabolism activity and CRC. (a) H9c2 cells were treated with H2O2 and DMSO or Nar, and the mitochondrial oxidative metabolism activity was examined. (b–e) The cells were suspended in CRC medium and permeabilized with digitonin. To these cells, 0.25 M Calcium Green-5N and 5 mM succinate were added. This addition was followed by a series of Ca2+ pulses (10 nmoles) at 3-minute intervals until onset of the permeability transition (plateau). The Relative Fluorescence Unit (RFU) was recorded by spectrophotometer technique. ∗p < 0.05 versus DMSO-treated cells. (b) Representative traces of the H9c2 cell treatments with H2O2 and vehicle are shown in dashed black and gray, respectively. (c) The results from the H2O2-treated cells are shown as the CRC normalized to the CRC of control (CRC0). The data shown are the means ± SEM of three independent experiments. ∗p < 0.05 versus vehicle. (d) Representative traces of senescent H9c2 cells cotreated with DMSO (dashed black), Nar (dark gray), and Nar + Pax (light gray). (e) The results from senescent cells treated with Nar and Nar + Pax are shown as the CRC normalized to the CRC of control (CRC0). The data shown are the means ± SEM of three independent experiments. ∗∗p < 0.01 versus DMSO-treated cells.

