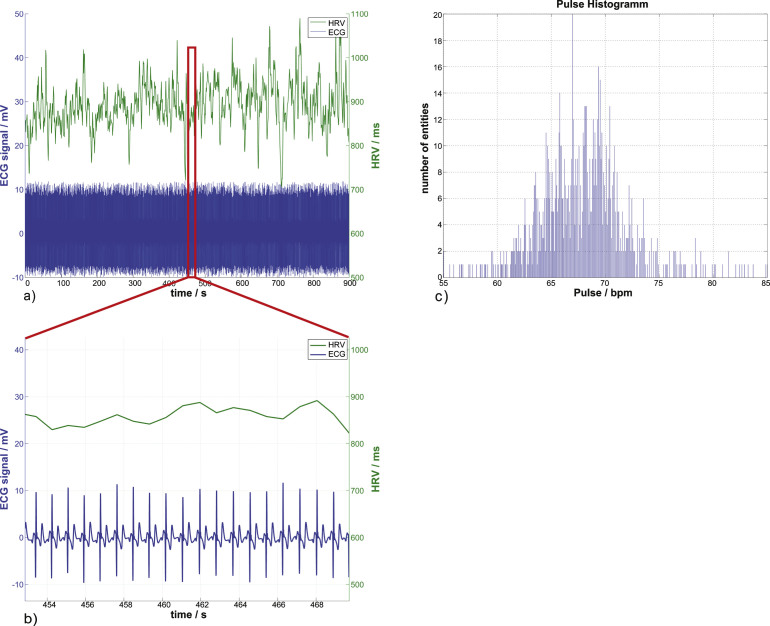
Fig.1.
A resting ECG, its corresponding heart rate variability, and the heartbeat distribution histogram. In (a) and (b), the lower time course displays the 1 kHz sampled ECG signal which has been denoised and corrected for baseline shift. The second time course above it is the heart rate variability, the time between consecutive R-Peaks in ms. The heartbeat distribution of the whole ECG signal can be seen in (c) with the mean heartbeat frequency of (67.72±4.13) bpm and the mean heart rate variability of (889.29±53.5) ms.

