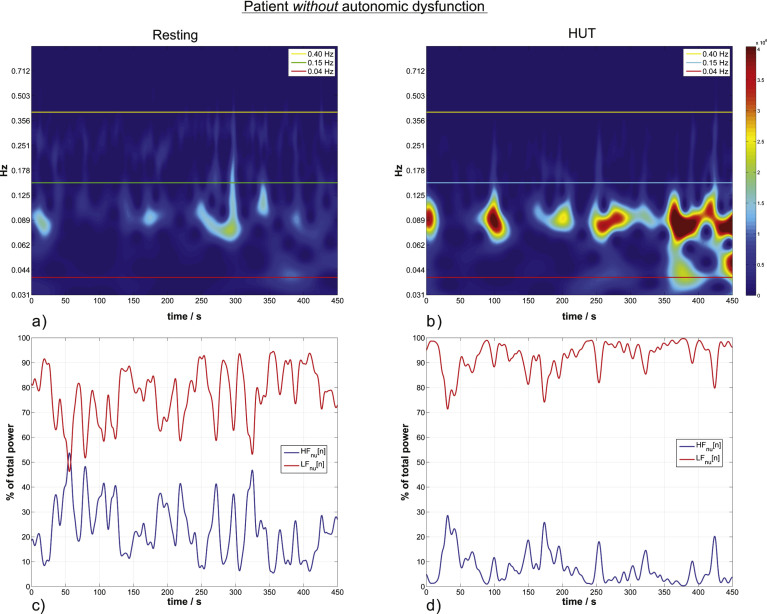
Fig.2.
HRV wavelet scalograms (a,b) and the corresponding normalized units time courses (momentary activity of each branch of the autonomic system) (c,d) in a patient without autonomic dysfunction. a) Autonomc activity in resting state. Horizontal lines define the confined LF and HF bands indicating sympathetic and parasympathetic activity. The color visualizes the actual activity shown on the color bar. Scalograms of the same patient are equally color scaled. b) HUT ANS activity for the same patient without autonomic dysfunction. LFnu increases 13% from the resting to the HUT position. c) The momentary ANS activity in the resting position versus the momentary activity during HUT in (d), the estimated momentary activity increases by 15% from resting to HUT.

