. 2017 Mar 21;18(1):89–94. doi: 10.4142/jvs.2017.18.1.89

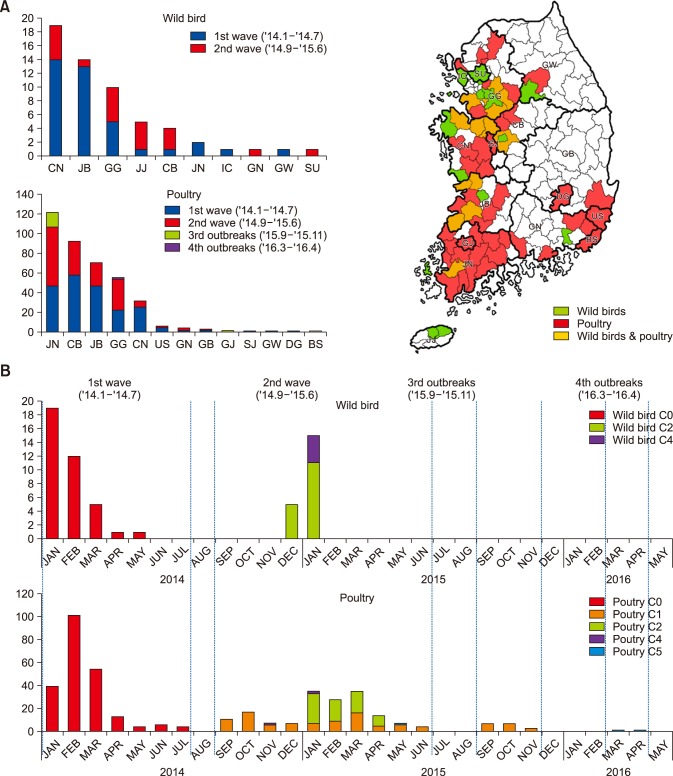
Fig. 1. Geographical and chronological distribution of H5N8 viruses in wild birds and poultry. (A) Bars represent the number of H5N8 virus isolates in wild birds (upper) and poultry (lower) according to the provinces of South Korea between January 2014 and April 2016. The map of South Korea indicates the provinces and species in which H5N8 viruses were isolated: wild birds (green), poultry (red), and wild birds and poultry (orange). JB, Jeonbuk; JN, Jeonnam; CB, Chungbuk; CN, Chungnam; GG, Gyeonggi; GN, Gyeongnam; JJ, Jeju; SU, Seoul; SJ, Sejong; GJ, Gwangju; IC, Incheon; GW, Gangwon; US, Ulsan; DG, Daegu; and GB, Gyeongbuk. (B) Bars represent the number of H5N8 virus isolates in wild birds (upper) and poultry (lower) according to time and virus subgroups from January 2014 to April 2016. Red, C0 subgroup; orange, C1 subgroup; green, C2 subgroup; purple, C4 subgroup; and blue, C5 subgroup.

Fig. 1