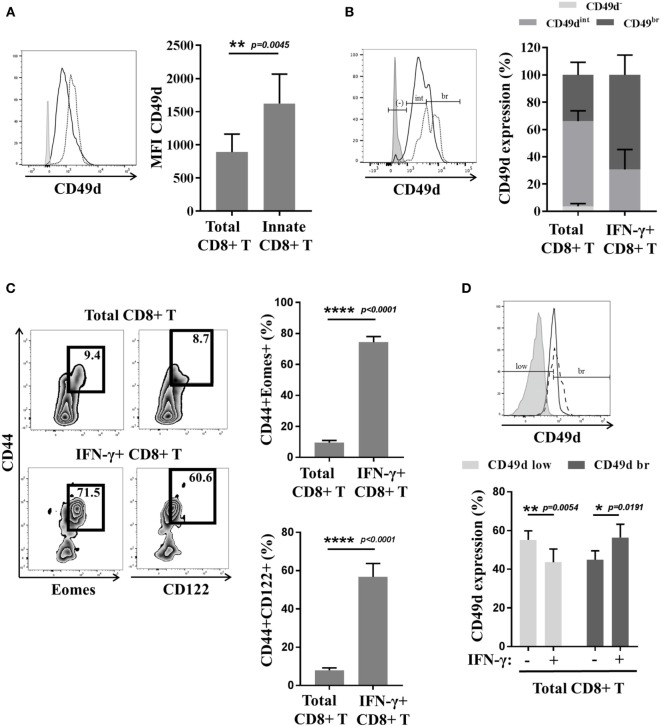
Figure 4.
The CD49d molecule correlates with the innate function of innate CD8(+) T cells in mice and humans. (A) Peripheral blood mononuclear cells (PBMCs) from healthy donors (HDs) (n = 6) were analyzed ex vivo by flow cytometry for CD49d expression in total and innate CD8(+) T cells. One representative sample is shown (left): total CD8(+) T cells (solid dark line), innate CD8(+) T cells (dotted black line), and isotype control (gray). Full cohort (MFI ± SD) is shown on the histogram (right). (B) PBMCs from HD (n = 5) were cultured 48 h in the presence of IL-12 + IL-18 and then analyzed ex vivo by flow cytometry for CD49d expression. Distribution of CD49d (percentage ± SD) in total CD8(+) T cells and in IFN-γ(+) CD8(+) T cells is shown on the histogram (right). One representative sample is shown (left): total CD8(+) T cells (solid dark line), IFN-γ(+) CD8(+) T cells (dotted black line), and isotype control (gray). (C,D) Splenocytes from Eomes-GFP mice were isolated, cultured for 16 h in the presence of IL-12 + IL-18, and analyzed by flow cytometry. (C) One representative sample is shown for the presence of CD44(+) Eomes(+) and CD44(+) CD122(+) cells among total CD8(+) (upper left panel) or IFN-γ(+) CD8(+) T cells (lower left panel). Frequency of each subset is displayed in the gate. Full cohort frequencies for CD44(+) Eomes(+) (upper histogram) and CD44(+) CD122(+) (lower histogram) cells among total CD8(+) and IFN-γ(+) CD8(+) T cells are shown. (D) CD49d expression was analyzed in total and IFN-γ(+) CD8(+) T cells. One representative sample is shown (upper panel): total CD8(+) T cells (solid dark line), IFN-γ(+) CD8(+) T cells (dotted black line), and isotype control (gray). Full cohort histograms for frequencies of CD49d(low) and CD49d(bright) are shown (lower panel) in total CD8(+) and IFN-γ(+) CD8(+) T cells.

