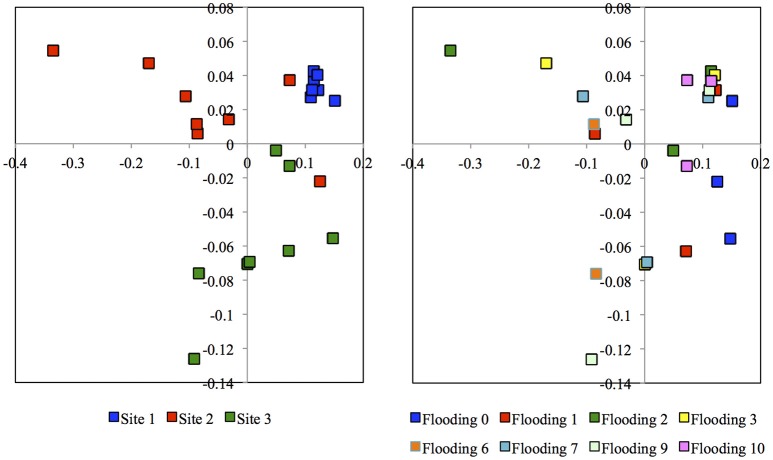
Figure 3.
Principal coordinate analysis of the weighted UniFrac distances of the archaeal OTUs clustered at a 97% similarity. Archaeal communities were from three sampling sites and never flooded (Flooded 0), flooded once (Flooded 1), flooded twice (Flooded 2), three times (Flooded 3), six times (Flooded 6), seven times (Flooded 7), nine times (Flooded 9), or ten times (Flooded 10). The first principal coordinate (PC1) explained 68% of the variation and PC2 11%.

