
FIGURE 4.
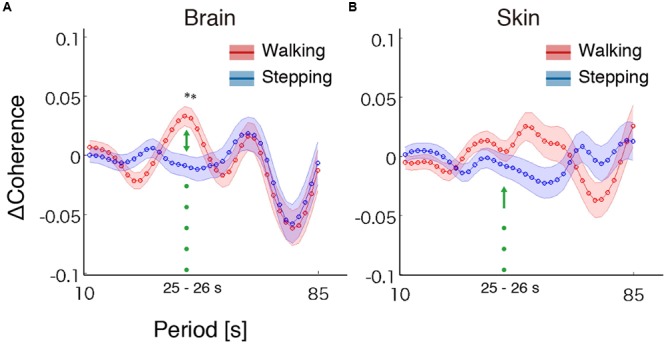
Results of coherence analysis. (A) Coherence differences when using cerebrally unique responses (brain) obtained by regressing out the skin blood flow. Each line and shading (red or blue) indicates the mean and the standard error of the mean of the coherence difference (Δ = sound–no-sound) during walking or stepping for all periods, respectively. Asterisks show the significant interaction effects by two-way repeated-measures analysis of variance (ANOVA; walking/stepping × sound/no-sound). To correct for multiple testing for all periods, false discovery rate correction (FDR, q = 0.05) was used. (B) Coherence differences when using skin blood flow data. No significant interaction effects were observed (FDR, q = 0.05).