Figure 2.
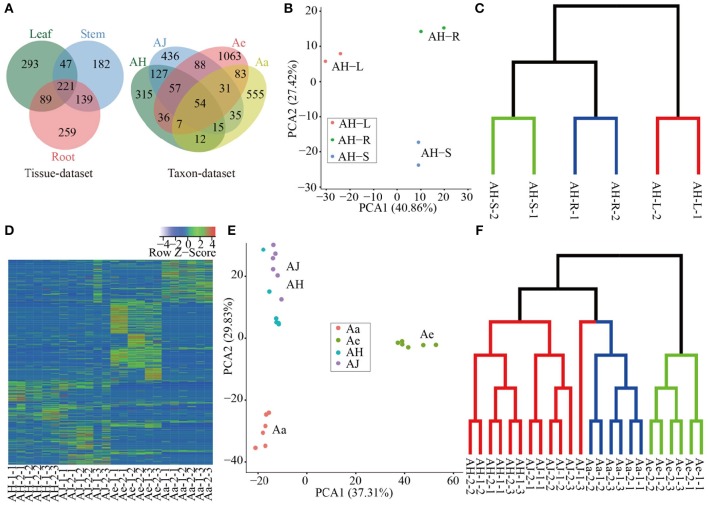
Expression analysis of circRNAs in different tissues and species. (A) Venn diagram of circRNA distribution in a tissue dataset and taxon dataset respectively. (B) PCA of all samples based of RPM matrix in tissue-dataset, each dot represents one sample. Principal components one and two (PC1 and PC2) collectively explained 68.28% of the variance. (C) Sample clustering of different tissues based on RPM matrix of circRNAs. The green, blue and red clades represent samples of stem, root and leaf respectively. (D) Heatmap of expression of all circRNAs in all samples, each row and column represent one circRNA and one sample, respectively, the color represents Z-score transformed from RPM of circRNAs. (E) PCA of all samples based of RPM matrix in taxon-dataset, each dot represents one sample. The PC1 and PC2 collectively explained 67.14% of the variance. (F) Sample clustering of different materials at various sampling stages during Psa invasion. The green, blue, and red clades represent samples of Ae, Aa, and Ac (including AH and AJ) respectively.

