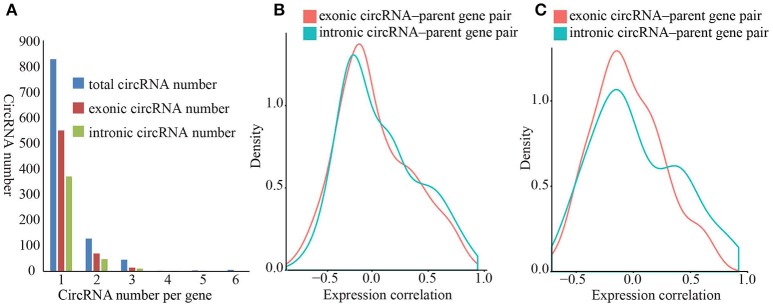
Figure 3.
Density diagram of expression correlation between circRNAs and parent genes. (A) Distribution of protein-coding genes that originated from circRNAs. The blue, red and green bars represent total circRNA number, exonic circRNA number and intronic circRNA number respectively. (B) Density diagram of correlation between circRNAs and parent genes. The red and green lines represent correlation of exonic circRNA–parent gene pairs and intronic circRNA–parent gene pairs respectively. (C) Density diagram of correlation between circRNAs and protein-coding genes that produce both exonic circRNAs and intronic circRNAs. The red and green lines represent correlation of exonic circRNA–parent gene pairs and intronic circRNA–parent gene pairs respectively.

