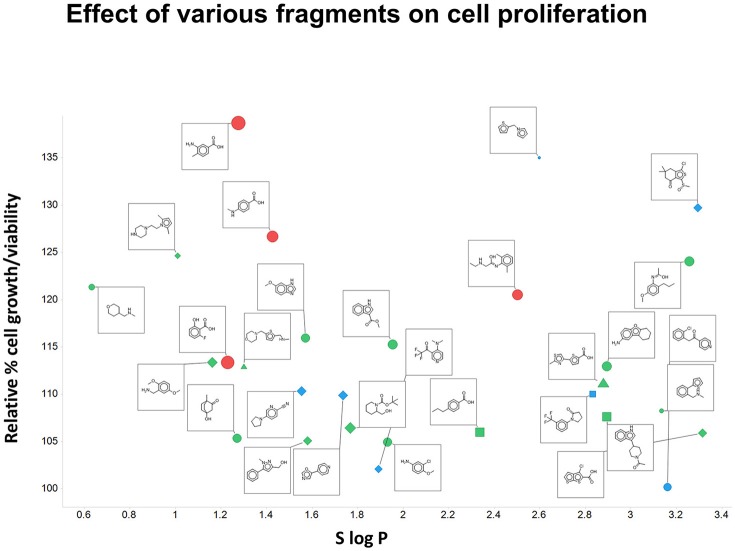
Figure 10.
Effect of various fragments on cell growth/viability relative to untreated controls. Also plotted are the number of H-bond acceptors (by shape; square 1, circle 2, diamond 3, triangle 4), H-bond donors (by color, blue 0, green 1, red 2, yellow 3), total polar surface area (by size of symbol, up to 63 Å2) and S log P (on the abscissa).

