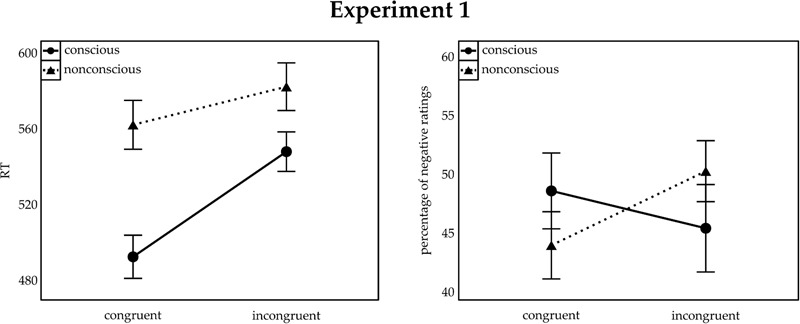
FIGURE 2.

Mean reaction time (RT) to target shapes (Left) and percentage of negative ratings of neutral symbols (Right) for Experiment 1. Congruent and incongruent trials are indicated on the x-axis. The separate lines illustrate conscious (solid lines) and non-conscious (dashed lines) trials. Error bars represent standard error of the mean (SEM).
