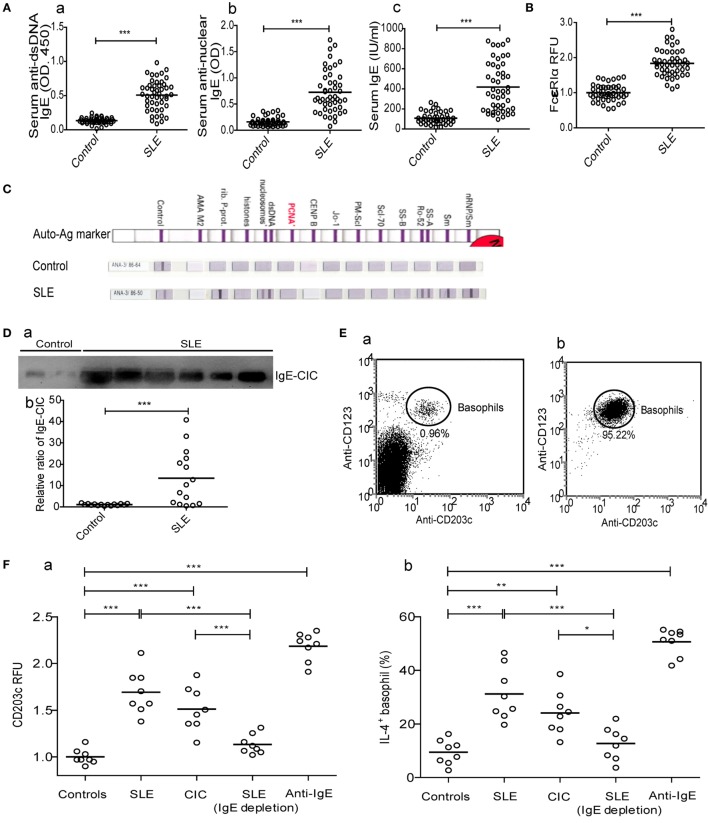
Figure 2.
Mechanism of peripheral basophil activation in patients with systemic lupus erythematosus (SLE). (A) Serum levels of anti-dsDNA IgE, antinuclear IgE, and total IgE (n = 48); (B) levels of FcɛRIα expression on peripheral basophils (n = 48); (C) antinuclear IgE profile (n = 36) (shown as representative images); and (D) the relative ratio of IgE-circulating immune complexes (CICs) (n = 15) in newly diagnosed patients with SLE and the same number of healthy controls. (E) Representative FCM dot-plot of peripheral basophils in PBMC of healthy controls (n = 6) (a) and post negatively isolated (b). (F) Activation [CD203c expression and interleukin (IL)-4 positive percentage] of basophils from healthy controls (n = 8) after stimulation with serum (20% of a total volume) of healthy control or newly diagnosed patients with SLE, CICs of newly diagnosed patients with SLE, serum (20% of a total volume) of newly diagnosed patients with SLE by depletion of IgE, or anti-IgE. *P < 0.05, **P < 0.01, ***P < 0.001. Data were analyzed via Student’s t-test (A,B,D) or one-way analysis of variance (F) and presented as scatter plots and are expressed as means.

