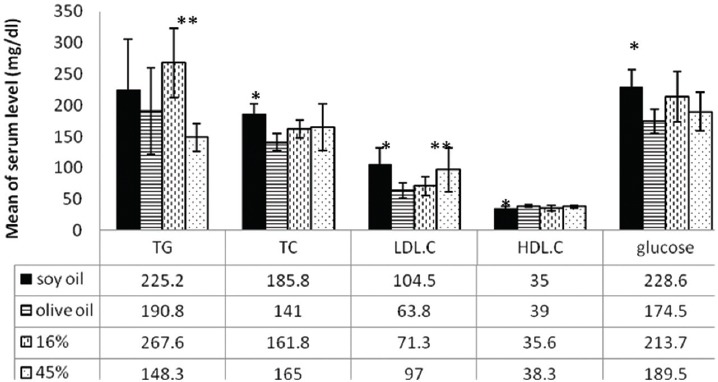
Figure 2.

Mean of maternal serum glucose and lipid profile (fed with soy oil and/or olive oil, 16% and/or 45% amounts, n=10 in each group). *Significant difference between the soy oil and olive oil fed diets; **Significant difference between the 16% and 45% oil fed mothers.
