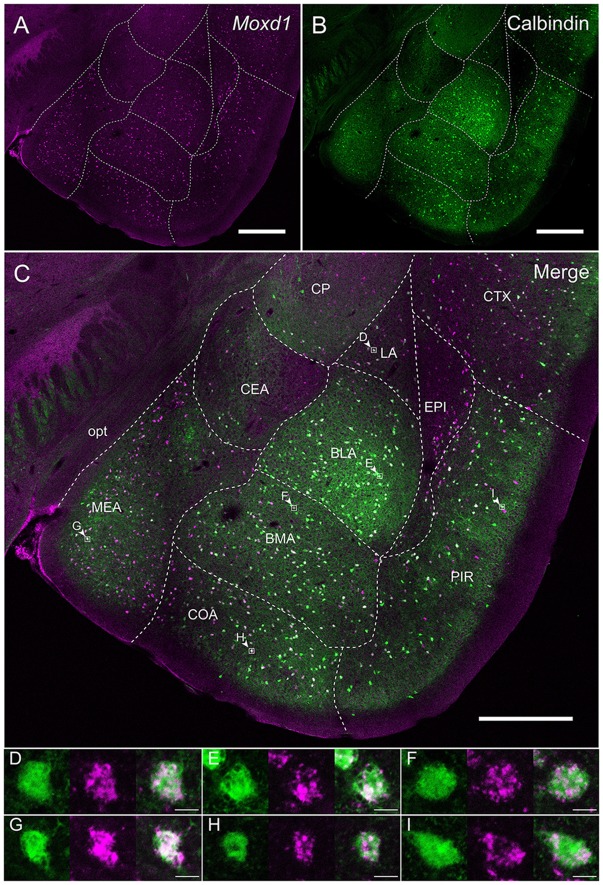
Figure 6.
Overlap of the Moxd1-positive cells and calbindin-immunoreactive cells in the amygdala nuclei and adjacent areas. (A) Moxd1, (B) calbindin, (C) merged image. Note that the MePD was located in the more posterior section. BLA, basolateral amygdala; BMA, basomedial amygdala; CEA, central amygdala; COA, cortical amygdala; CP, caudoputamen; CTX, cerebral cortex; EPI, endopiriform nucleus; LA, lateral amygdala; MEA, medial amygdala; PIR, piriform cortex; opt, optic tract. Scale bars: 0.5 mm. (D–I) High magnification images of double-labeled cells indicated by small rectangles and arrowheads in (C). (D) LA, (E) BLA, (F) BMA, (G) MEA, (H) COA, (I) PIR. Scale bars: 10 μm.

