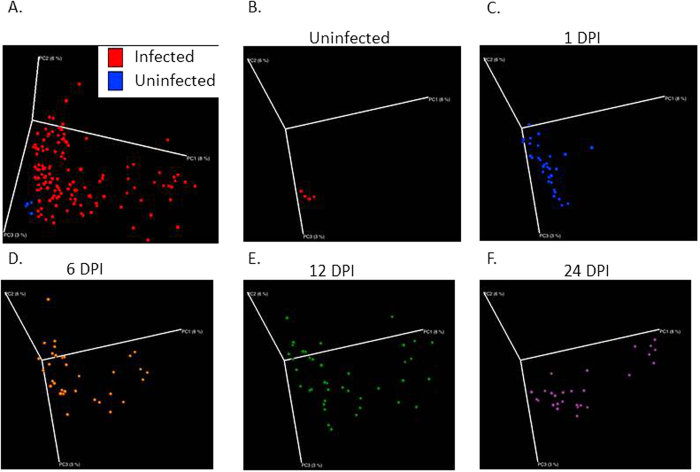
Figure 3. As infection progresses, microbial profiles become increasingly spread along the 3D PCoA space.
(A) Uninfected mice cluster separately from all infected mice on a principal coordinate analysis (PCoA) based upon unweighted UniFrac distances, which was confirmed with the adonis statistic. (B–F) Separating each timepoint indicates dispersion of microbial communities along the first PCoA as the infection continues to 24 DPI.

