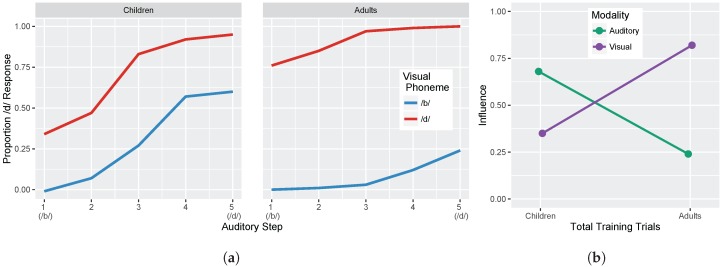
Figure 1.
(a) Schematic illustration of predicted results showing the observed proportion of /d/ responses as a function of five auditory and two visual steps (based on [32]). Large differences are expected over the course of development. Children respond largely based on auditory information (i.e., their proportion of /d/ responses is similar regardless of visual information). Conversely, adults respond largely based on visual information (i.e., their proportion of /d/ responses is similar regardless of auditory information). The amount of auditory influence is shown by the difference in response proportion between one end of the auditory continuum to the other (e.g., from one end of the blue line to the other). The amount of visual influence is shown by the difference in response proportion between the two lines (e.g., from the blue line to the red line at the same auditory step); (b) Schematic illustration showing the change in auditory and visual influence over development: visual influence increases whereas auditory influence decreases (see Equations (3) and (4)).

