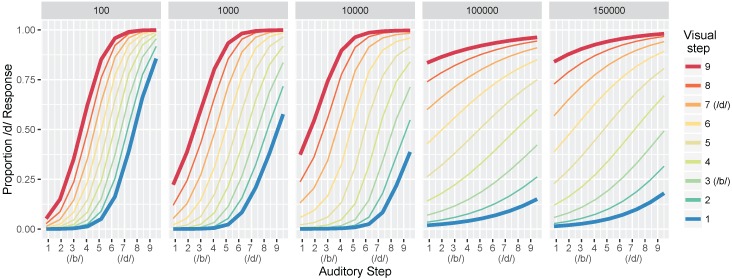
Figure 5.
Simulation 1: model identification responses as a function of the nine auditory and nine visual steps and the total training trials (panels). Data are the mean proportion of /d/ responses averaged across 500 simulation runs of the model. The bolded red and blue lines are highlighted to correspond to the schematic predictions in Figure 1a; the 1000 panel is most closely matched to the “Children” panel and the 100,000 and 150,000 panels match the “Adult” panel.

