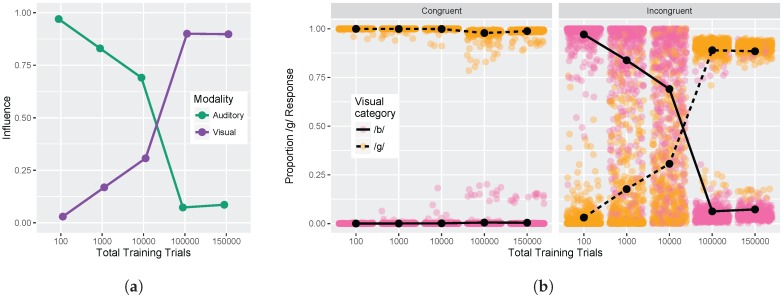
Figure 10.
Simulation 2: Congruency effect. (a) Change in auditory and visual influence over development: visual influence increases whereas auditory influence decreases (as in the schematic Figure 1b and Simulation 1 Figure 6a); (b) Left panel displays model responses for congruent stimuli, and right panel displays responses for incongruent stimuli. Lines represent mean response across the 500 simulation runs. Data are plotted as the proportion of /d/ responses as a function of the visual stimulus (as in Figure 6b).

