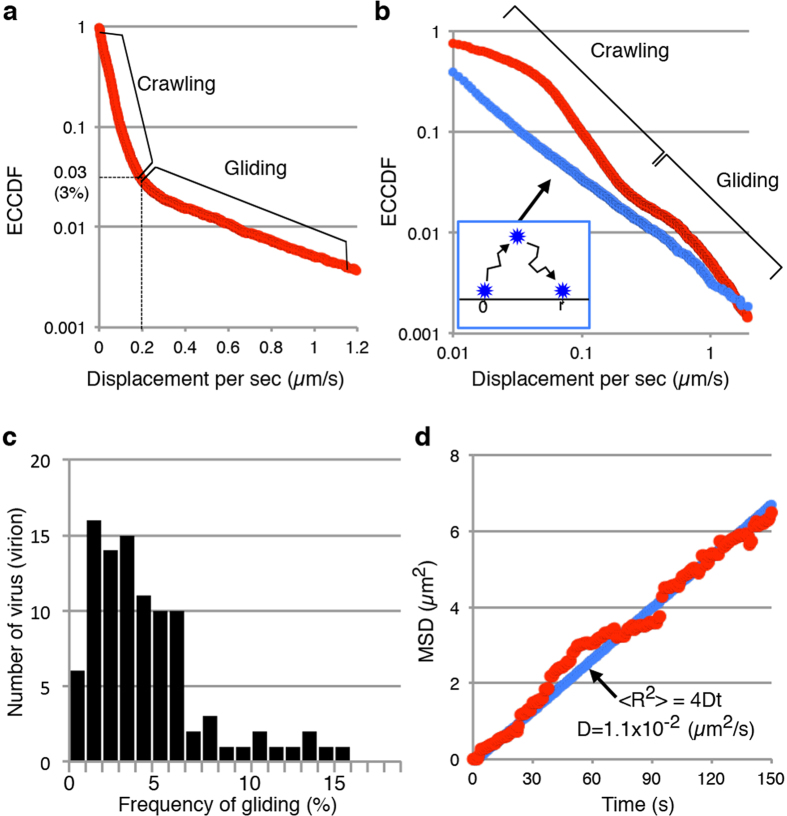
Figure 2. Quantitative analysis of IAV movements.
(a–d) Movements of 100 Aichi2 virus particles were analysed. ECCDFs of virus displacement per second are presented on a semi-log plot (a) and a log-log plot (b). In both plots, ECCDFs are shown in red. A double exponential function in which the boundary is approximately 0.2 μm was observed in the semi-log plot of the ECCDF (a). ECCDF of simulated data (blue) assuming that the viruses float from the glass surface into water, move in a Brownian fashion, and return to the surface is shown for comparison with the ECCDF of actual virus movements (b). Individual virus motility was analysed (c). Gliding frequency was calculated by dividing the number of image frames recording gliding events by the number of total frames. The displacement of IAV particles was analysed, using a two-dimensional random diffusion (random walk) model (d). The mean square displacement* (MSD) of viruses (red) was fitted by the equation for two-dimensional random diffusion (blue): 〈R2〉 = 4Dt, where 〈R2〉 is the MSD of viruses and D is the diffusion coefficient. This fitting resulted in D = 1.1 × 10⁻² μm2/s. *Note: the displacement (R) of the MSD in (c) is taken from the position where the virus particles initially attach, which is not the same as the displacement per second shown in (a and b).

