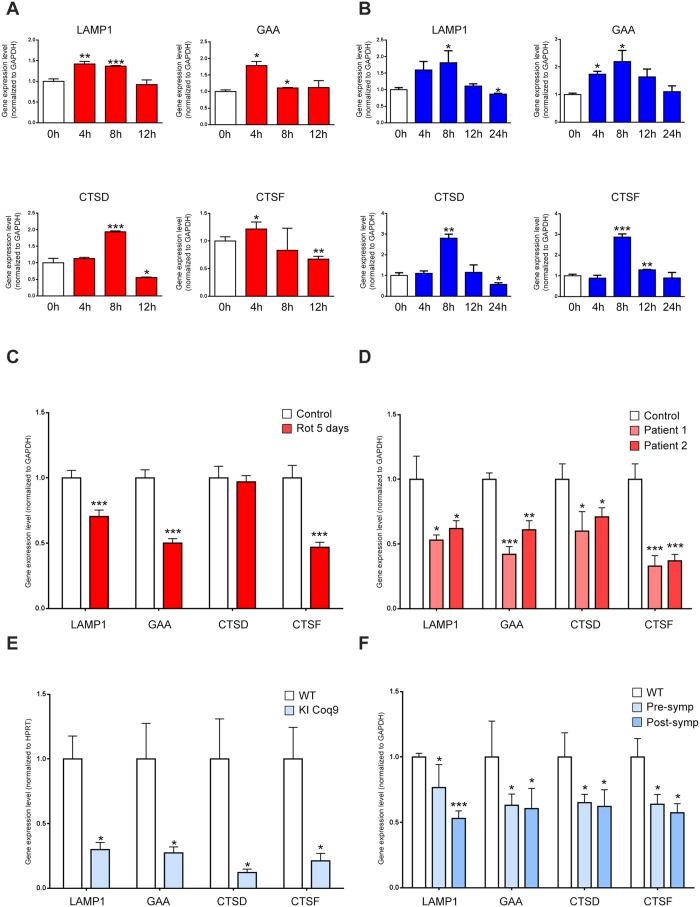
Figure 1. Acute and chronic mitochondrial malfunction differentially affect the transcriptional program of lysosomal biogenesis.
(A) Relative transcript levels of LAMP1, GAA, CTSD and CTSF in MEFs treated with the respiratory chain complex I inhibitor rotenone (250 nM), collected at 0, 4, 8 and 12 hours of treatment, normalized to GAPDH. The bars represent average and standard error of the mean (S.E.M.) (N = 4) with p-values indicated (*p < 0.05; **p < 0.005; ***p < 0.001). (B) Relative transcript levels of LAMP1, GAA, CTSD and CTSF in MEFs treated with the uncoupler carbonyl cyanide 3-chlorophenylhydrazone (CCCP) (10 μM), collected at 0, 4, 8, 12 and 24 hours of treatment, normalized to GAPDH. The bars represent average and S.E.M. (N = 4) with p-values indicated (*p < 0.05; **p < 0.005; ***p < 0.001). (C) Relative transcript levels of LAMP1, GAA, CTSD and CTSF in MEFs treated with the respiratory chain complex I inhibitor rotenone (250 nM) for 5 days, normalized to GAPDH. The white bar corresponds to the control MEFs (treated with DMSO) and the red bars to the MEFs treated with rotenone. The bars represent average and S.E.M. (N = 4); t test p-values (*p < 0.05; **p < 0.005; ***p < 0.001). (D) Relative transcript levels of LAMP1, GAA, CTSD and CTSF in fibroblasts from patients with mutations in respiratory chain complex I subunits (red bars) and control individuals (white), normalized to GAPDH. Patient 1 presents a mutation in the NDUFV1 subunit26 and patient two has a mutation in the NDUFV2 subunit27. The bars represent average and S.E.M. (N = 4) with p-values indicated (*p < 0.05; **p < 0.005; ***p < 0.001). (E) Relative transcript levels of LAMP1, GAA, CTSD and CTSF in MEFs from Coq9R239X mice, normalized to HPRT. The white bar corresponds to the wild-type mice MEFs and the blue bars to the Coq9R239X MEFs. The bars represent average and S.E.M. (N = 4) with t test p values indicated (*p < 0.05; **p < 0.005; ***p < 0.001). (F) Relative transcript levels of LAMP1, GAA, CTSD and CTSF in heart from Coq9R239X mice, normalized to GAPDH. The white bars corresponds to the wild-type mice, the blue bars to the Coq9R239X. The bars represent average and S.E.M. (N = 5) with p-values indicated (*p < 0.05; **p < 0.005; ***p < 0.001).

