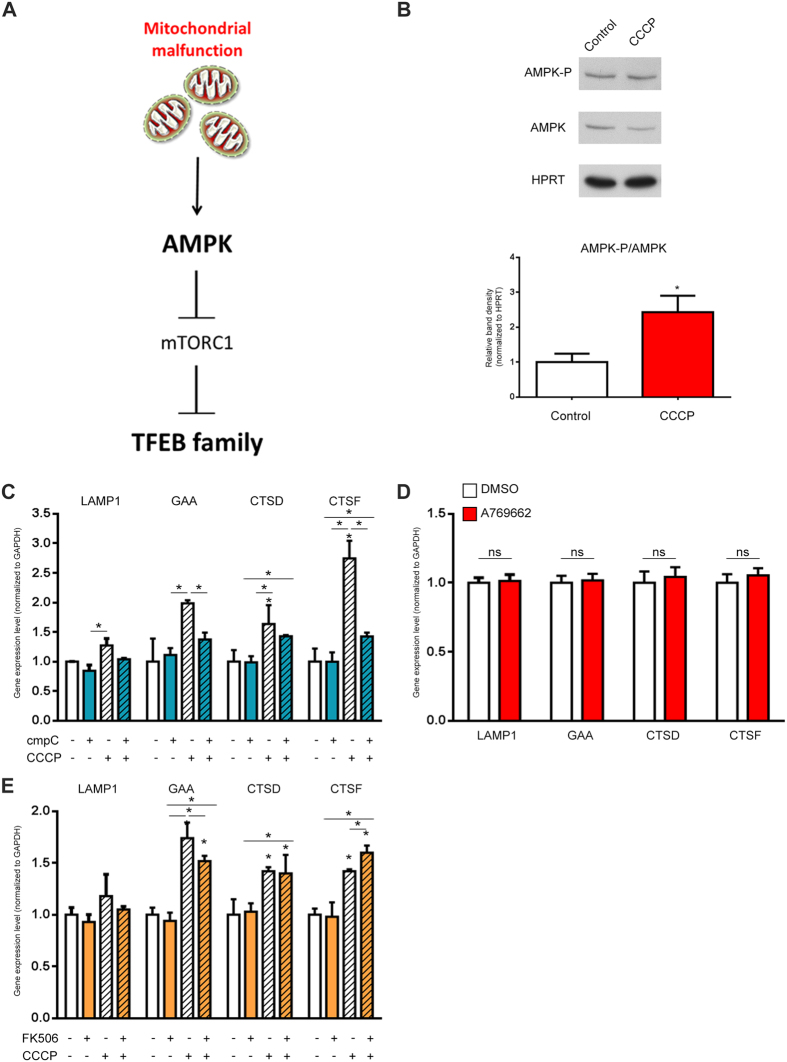
Figure 4. Lysosomal biogenesis triggered by acute mitochondrial stress requires AMPK signaling.
(A) Mitochondrial stress leads in lysosomal biogenesis through TFEB. The damage mitochondria release signalling that affects AMPK, which is involved in lysosomal biogenesis through TFEB family pathway. (B) Western blot analysis of whole-cells extracts showing increased AMPK activation, by measuring AMPK and AMPK-P in HeLa cells treated 4 hours with CCCP (10 μM). The graph shows the ratio of AMPK-P/AMPK protein normalized to HPRT. The white bar corresponds to the control HeLa cells and the red bar to the HeLa cells treated with CCCP. The bars represent average and S.E.M. (N = 4) with t test p-value indicated (*p < 0.05; **p < 0.005; ***p < 0.001). (C) Transcript levels of LAMP1, GAA, CTSD and CTSF mRNA transcript levels in HeLa cells treated 4 hours with CCCP 10 μM and dorsomorphin (compound C) (10 μM), normalized to GAPDH mRNA transcript level. The white bar corresponds to the control HeLa cells, the bars with pattern to HeLa cells treated with CCCP and the blue bars corresponds to HeLa cells treated with compound C. The bars represent average and S.E.M. (N = 6) with p-values indicated (*p < 0.05; **p < 0.005; ***p < 0.001). (D) Transcript levels of of LAMP1, GAA, CTSD and CTSF mRNA transcript levels in HeLa cells treated 4 hours with A769962, normalized to GAPDH mRNA transcript level. The white bar corresponds to the control HeLa cells and the red bars to the HeLa cells treated with A769662 (100 μM). The bars represent average and S.E.M. (N = 4). No statistically significant changes were observed. (E) Transcript levels of LAMP1, GAA, CTSD and CTSF mRNA transcript levels in HeLa cells treated 4 hours with FK506 (5 μM) and CCCP (10 μM), normalized to GAPDH mRNA transcript level. The white bar corresponds to the control HeLa cells, the bars with pattern to HeLa cells treated with CCCP and the orange bars corresponds to HeLa cells treated with FK506. The bars represent average and S.E.M. (N = 6) with p-values indicated (*p < 0.05; **p < 0.005; ***p < 0.001).

