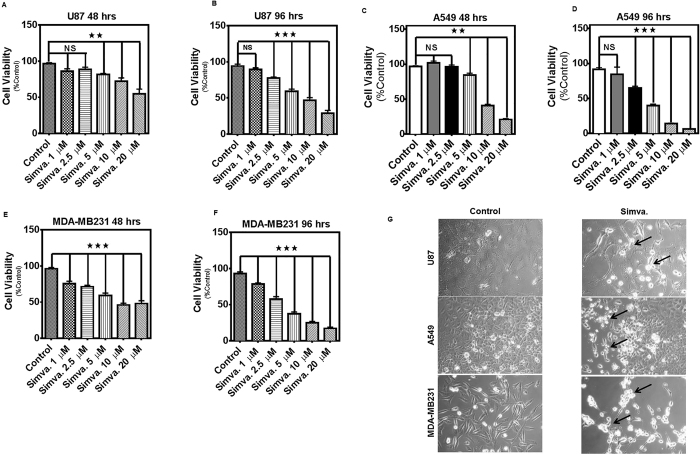
Figure 1. Simvastatin induces cell death in glioblastoma, non-small lung cancer cell, and breast cancer cell lines.
(A,B) U87 cells were treated with simvastatin (1, 2.5, 5, 10 or 20 μM) and cell viability was assessed 48 and 96 hrs thereafter by MTT assay. Control cells for each time point were treated with the solvent control (DMSO). Results are expressed as percentage of corresponding time point control and represent the means ± SD of 15 replicates in three independent experiments (**P < 0.01; ***P < 0.001). (C,D) A549 cells were treated with simvastatin (1, 2.5, 5, 10 or 20 μM) and cell viability was assessed 48 and 96 hrs thereafter by MTT assay. Control cells for each time point were treated with the solvent control (DMSO). Results are expressed as percentage of corresponding time point control and represent the means ± SD of 15 replicates in 3 independent experiments (**P < 0.01; ***P < 0.001). (E,F) MDA-MB-231 cells were treated with simvastatin (1, 2.5, 5, 10 or 20 μM) and cell viability was assessed 48 and 96 hrs thereafter by MTT assay. Control cells for each time point were treated with the solvent control (DMSO). Results are expressed as percentage of corresponding time point control and represent the means ± SD of 15 replicates in three independent experiments (***P < 0.001). (G) U87, A549, and MDA-MB231 cells treated with 10 μM simvastatin for 60 hrs were then photographed under phase contrast microscopy settings. Arrows indicate partially detached cells with condensed morphology.

