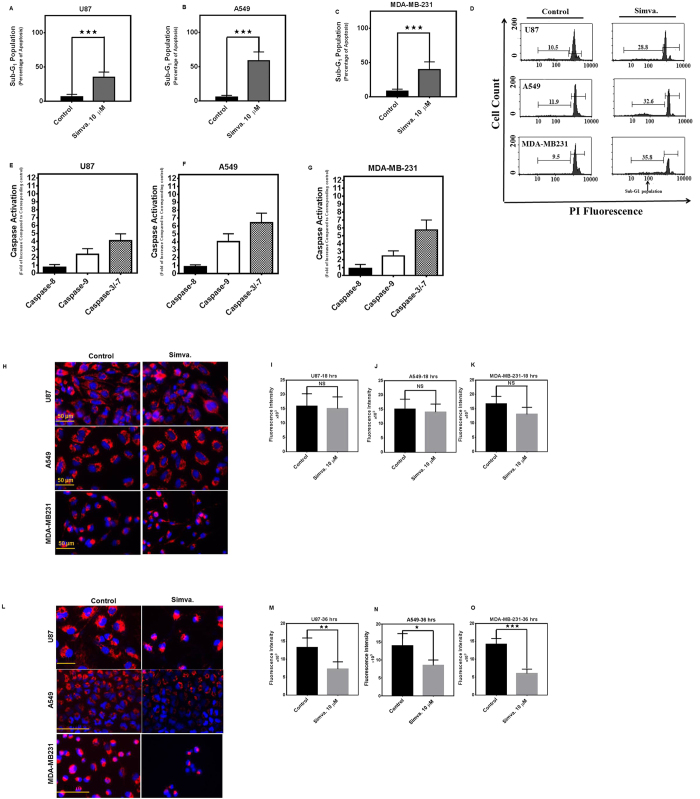
Figure 2. Simvastatin induces intrinsic apoptosis in glioblastoma, non-small lung cancer cell, and breast cancer cell lines.
Percent sub-G1 (A) U87, (B) A549, (C) MDA-MB-231 abundance induced by simvastatin (10 μM) or DMSO solvent control after 60 hrs. Results represent the means ± SD of 9 replicates in three independent experiments. *P < 0.05; and ***P < 0.001 compared to time-matched control. Representative figures of the flow cytometry histogram for U87, A549 and MDA-MB-231 are shown (D). Effects of simvastatin (10 μM) treatment (36 hrs) on caspase-8, caspase-3/-7, and caspase-9 enzymatic activity, as detected by Caspase-Glo® luminometric assay in U87 (E), A549 (F), MDA-MB-231 (G). Caspase activity normalized to that measured for solvent-only treated cultures is represented on the Y-axis. The data represent mean ± SD of triplicate experiments performed on 3 independent experiments. U87, A549, and MDA-MB231 cells were treated with 10 μM simvastatin for 18 and 36 hrs. Control cells were treated with media and vehicle control (DMSO). Cells were stained with TMRM, Hoechst, and imaged by standard fluorescence techniques. Simvastatin (10 μM, 18 hrs) did not significantly change TMRM fluorescence intensity in U87, A549, and MDA-MB231 cells (H–K),while simvastatin (10 μM, 36 hrs) significantly decreased TMRM florescence intensity in U87 (P < 0.01), A549 (P < 0.05), and MDA-MB231 (P < 0.001) (L–O) which indicates the decrease of mitochondrial membrane potential in simvastatin-treated cells. Data represent the average values from triplicates of three independent experiments.

