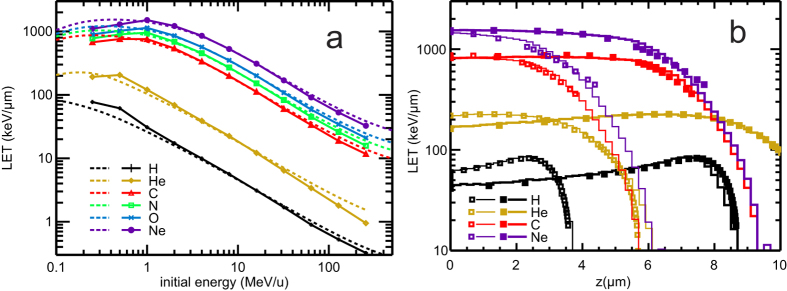
Figure 2. LET in dependence on the initial particle energy and penetrated depth.
Panel a: LET calculated from energy deposited within the cell nucleus (symbols connected by solid lines to guide the eyes) and comparison to stopping powers from ICRU24,50 (dotted lines). Panel b: LET determined from energy deposited in 200 nm slabs perpendicular to particle transport direction (histograms) for ions with 0.5 MeV/u (thick lines) or 0.25 MeV/u initial energy (thin lines). Stopping power data from ICRU24,50 shown by symbols (0.5 MeV/u: filled squares, 0.25 MeV/u: empty squares).

