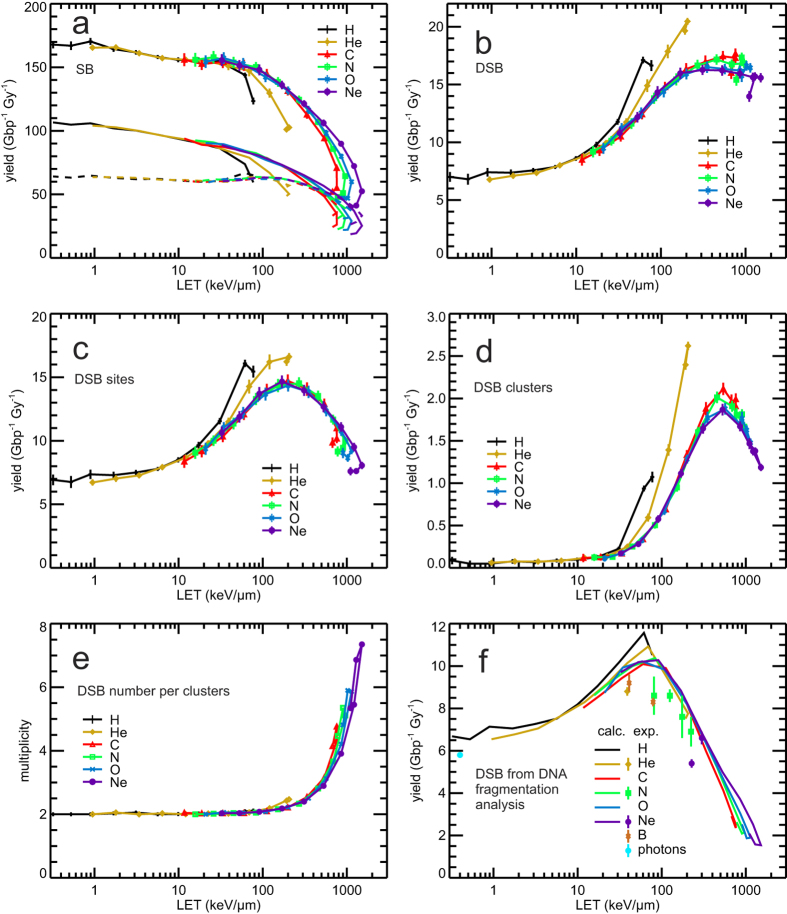
Figure 3. Ion irradiation-induced DNA damage in dependence on LET.
In panel a–e, simulation results are shown by symbols connected by lines to guide the eyes; error bars in panel a–d denote two standard errors of the mean (~95% confidence intervals) of the performed simulations. Panel a: SB yields from direct effects (dashed lines), indirect effects (dash-dotted lines), and both effects (symbols and solid lines). Panel b: DSB yields, in which isolated ones as well as individual DSB in DSB clusters are scored. Panel c: Yields of DSB sites, which comprise isolated DSB and DSB clusters; a DSB cluster is scored as one DSB site. Panel d: Yields of DSB clusters; a cluster includes two or more DSB within not more than 25 bp distance. Panel e: Average multiplicity of DSB in a cluster. Panel f: DSB induction by 60Co γ-rays, He, B, N and Ne ions measured by the pulsed-field gel electrophoresis technique from DNA fragments sized between 5 kbp and 6 Mbp52,53 (symbols) and corresponding simulation results considering detectable DNA fragments (solid lines).

