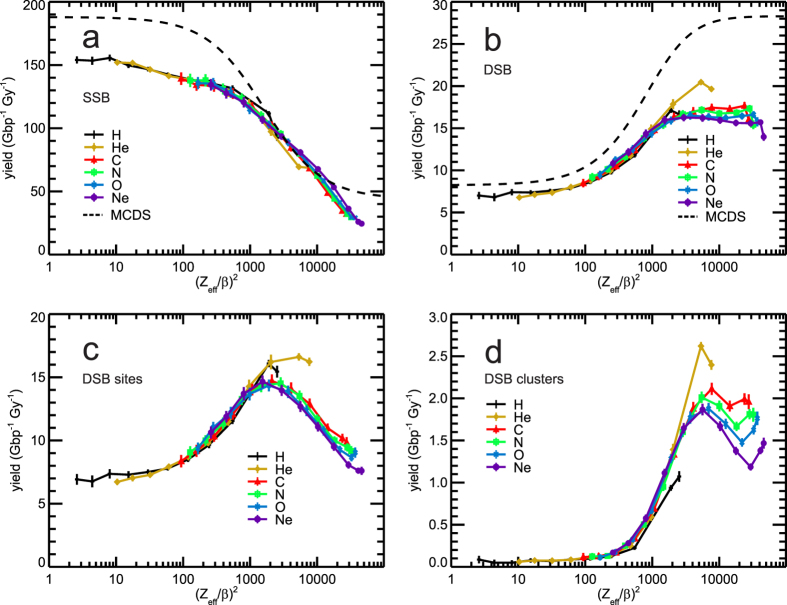
Figure 4. Ion irradiation-induced DNA damage in dependence on (Zeff/β)2.
Simulation results are shown by symbols connected by lines to guide the eyes; error bars denote two standard errors of the mean (~95% confidence intervals) of the performed simulations. Panel a: SSB, i.e. breaks in DSB are not included (symbols and solid lines), with prediction of MCDS17 (dashed line). Panel b: DSB yields (symbols and solid lines) with prediction of MCDS17 (dashed line). Panel c: Yields of DSB sites, which comprise isolated DSB and DSB clusters; a DSB cluster is scored as one DSB site. Panel d: Yields of DSB clusters; a cluster includes two or more DSB within not more than 25 bp distance.

