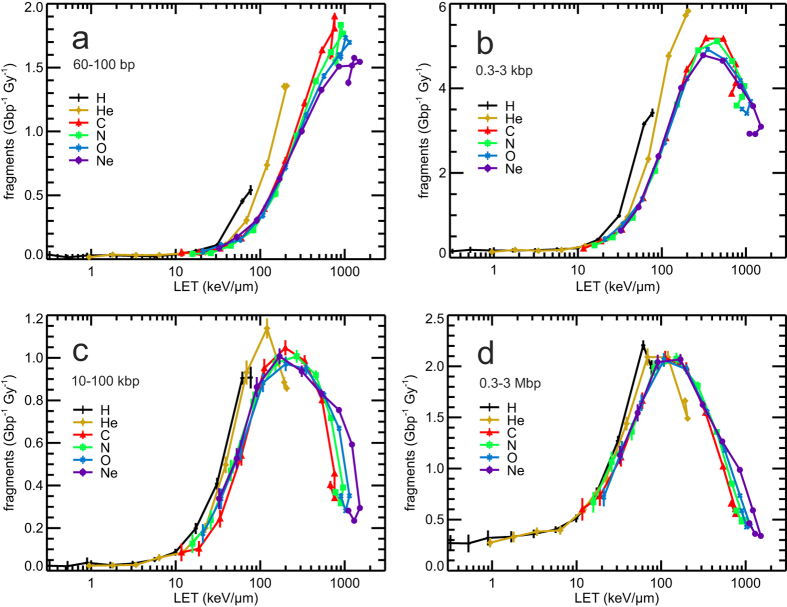
Figure 5. Simulation results on the yields of DNA fragments by single ion tracks.
Simulation results are shown by symbols, connected by lines to guide the eyes. Error bars denote two standard errors of the mean of the performed simulations. The fragment size intervals (panel a: 60–100 bp; panel b: 0.3–3 kbp; panel c: 10–100 kbp; panel d: 0.3–3 Mbp) correspond to fragments formed when an ion track induces a pair of DSB sites within a nucleosome, chromatin fiber, a chromatin fiber loop, and a chromatin domain (or a giant loop), respectively.

